Fig. 1
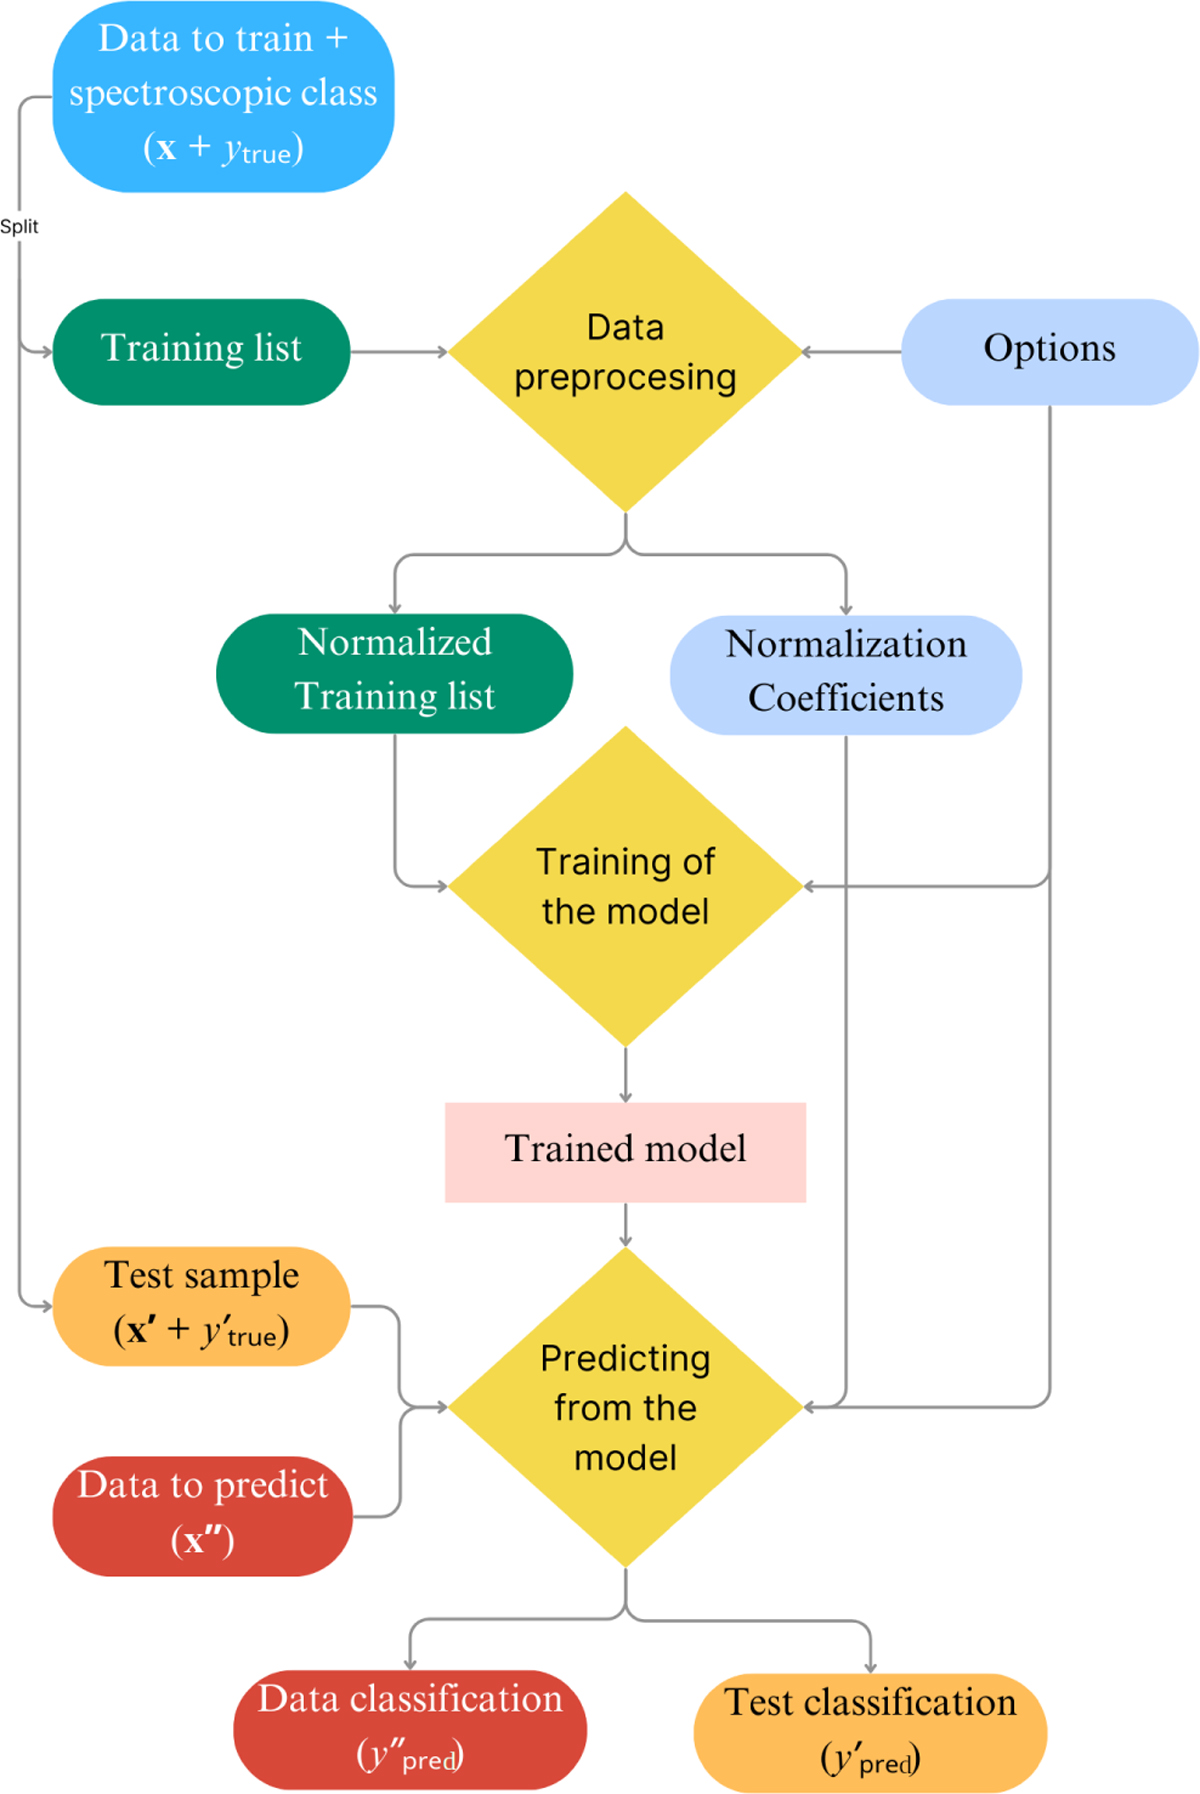
Download original image
Flowchart illustrating the processing flow of BANNJOS. Central components are represented by yellow rhombuses, while inputs and outputs are indicated by rounded rectangles. The procedure commences with the training data (depicted in blue, located at the top-left) and the options (illustrated in light blue, positioned at the top-right), which govern the behavior of BANNJOS. Throughout the chart, colors show the data type: light blue for options or variables controlling the process, green for training data, orange for the test sample, and red for the data on which predictions are intended to be made. An general description of BANNJOS can be found in Sect. 2. More detailed information about the main processing stages of BANNJOS applied to J-PLUS can be found in Section.
Current usage metrics show cumulative count of Article Views (full-text article views including HTML views, PDF and ePub downloads, according to the available data) and Abstracts Views on Vision4Press platform.
Data correspond to usage on the plateform after 2015. The current usage metrics is available 48-96 hours after online publication and is updated daily on week days.
Initial download of the metrics may take a while.