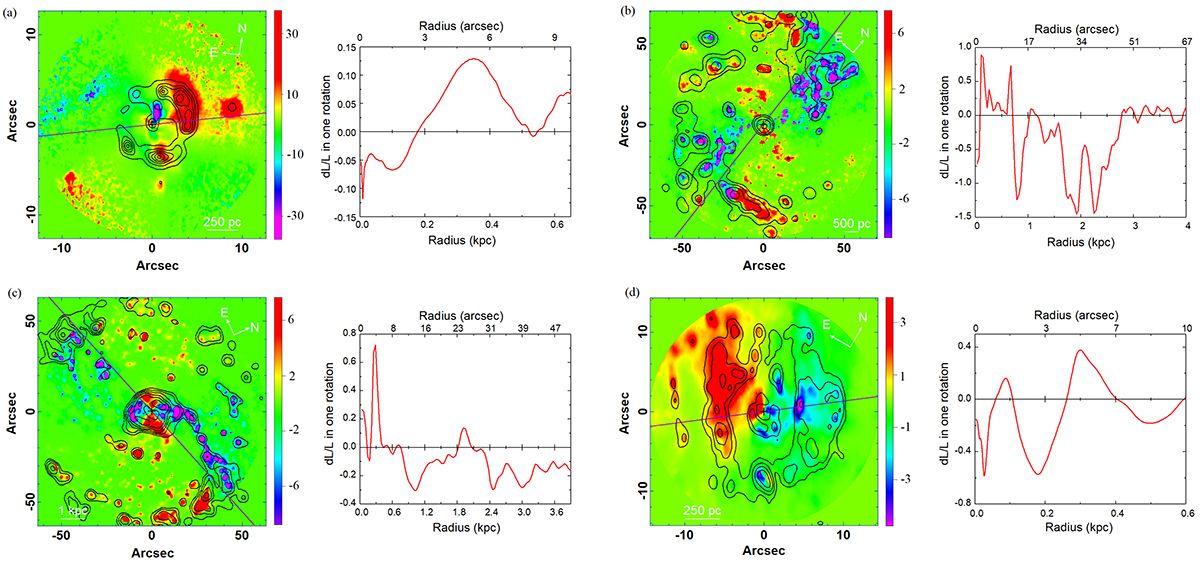
Fig. B.1.
Download original image
Torque maps of Hα emission line from MUSE data cube of: (a)NGC 1300 with contours levels of 1 to 6 times 2.4 ×10−17 erg Å−1 cm−2 s−1, (b)NGC 4303 with contours levels of 1, 2.5, 6, and 14.3 times 1.75 ×10−17 erg Å−1 cm−2 s−1, (c) NGC 4321 with contours levels of 1, 2, 3.7, 7.1, 13.3 and 25.1 times 5.4 ×10−18 erg Å−1 cm−2 s−1, and (d) NGC 5248 with contour levels of 1, 1.8, 3.2 and 5.7 times 5.7 ×10−17 erg Å−1 cm−2 s−1.
Current usage metrics show cumulative count of Article Views (full-text article views including HTML views, PDF and ePub downloads, according to the available data) and Abstracts Views on Vision4Press platform.
Data correspond to usage on the plateform after 2015. The current usage metrics is available 48-96 hours after online publication and is updated daily on week days.
Initial download of the metrics may take a while.