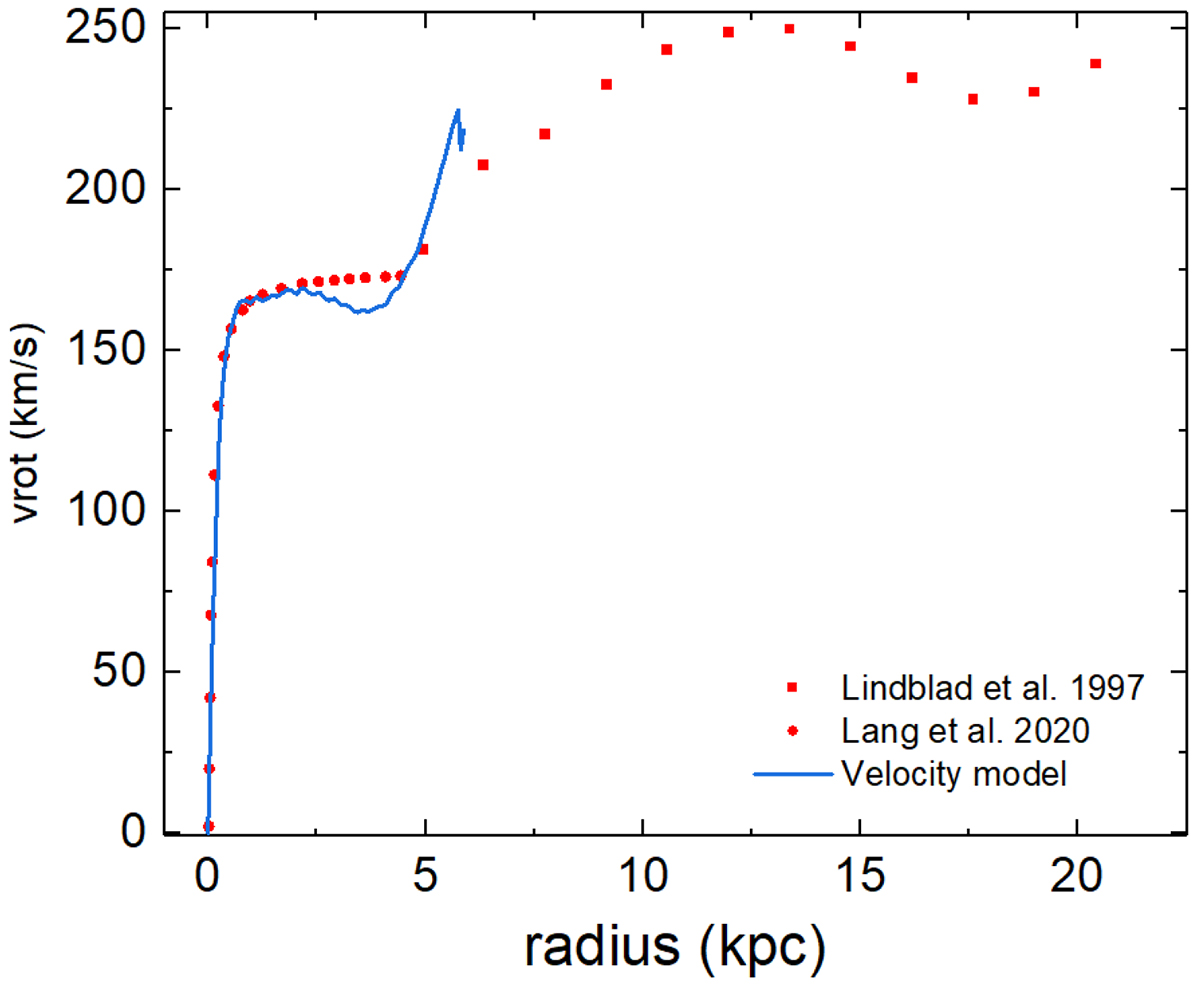
Fig. 24.
Download original image
Gas velocity rotation curves from HI (Lindblad et al. 1997) (red squares) and from CO (Lang et al. 2020) (red points) of NGC 1300 used to compute the torque map values of the data sets in panels (c) and (d). Only the highest points of each curve were kept. The blue curve represents the velocity model obtained from the computed potential (with limitations of the red image cut-off beyond 5 kpc).
Current usage metrics show cumulative count of Article Views (full-text article views including HTML views, PDF and ePub downloads, according to the available data) and Abstracts Views on Vision4Press platform.
Data correspond to usage on the plateform after 2015. The current usage metrics is available 48-96 hours after online publication and is updated daily on week days.
Initial download of the metrics may take a while.