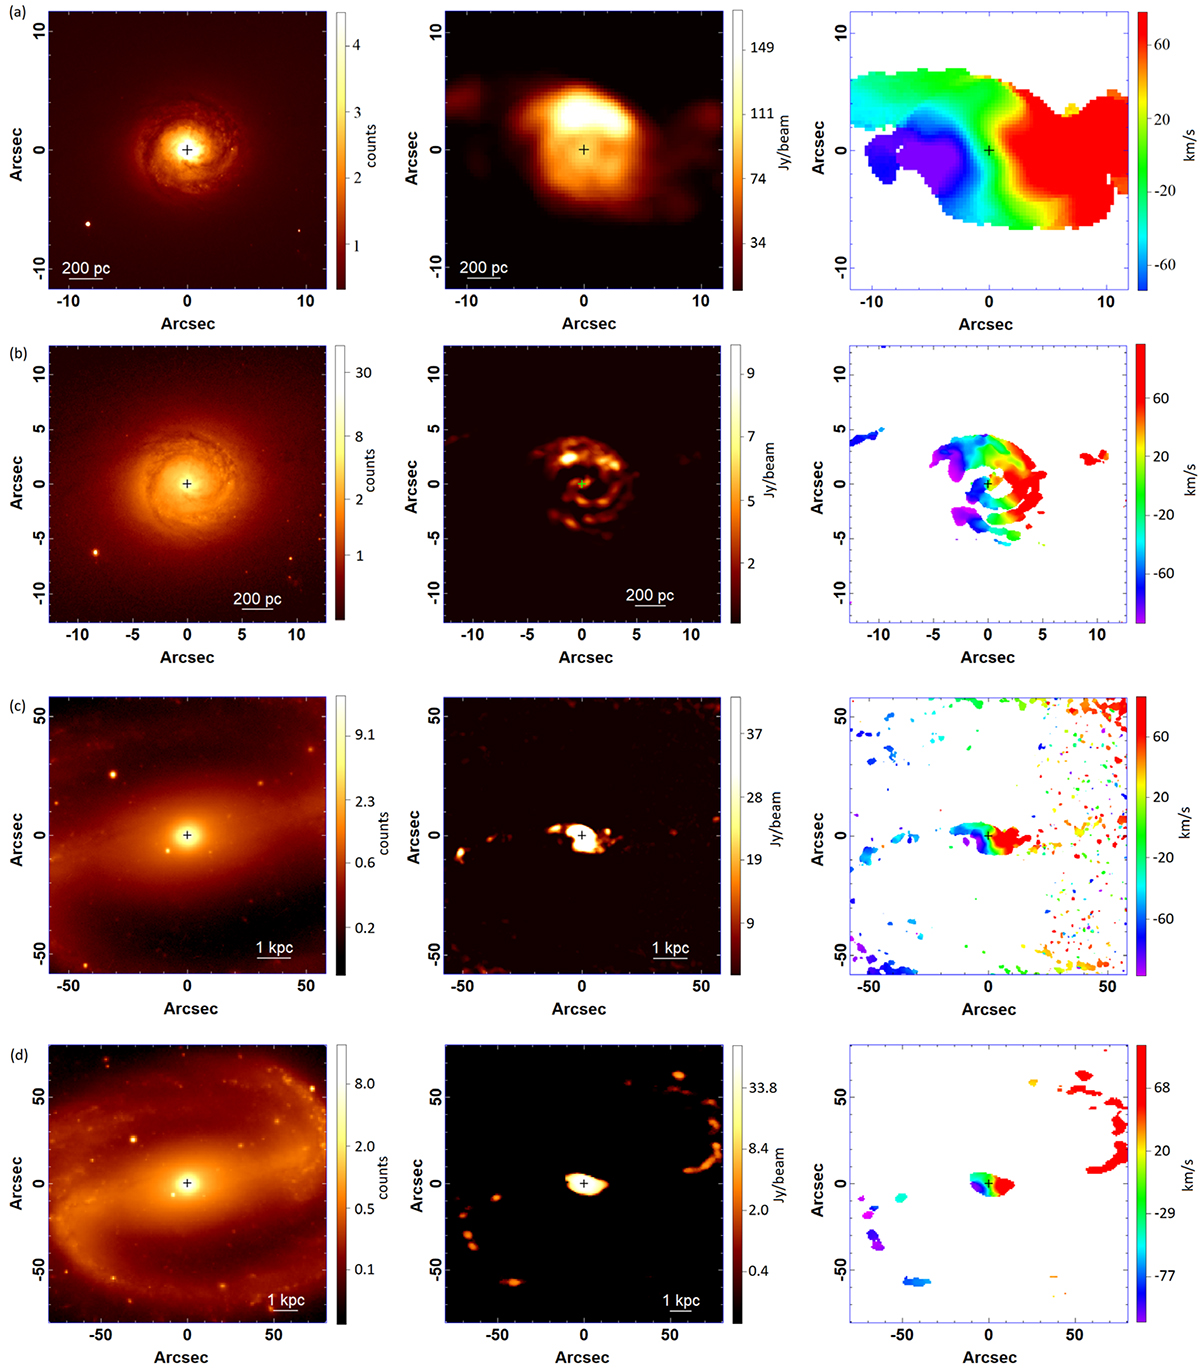
Fig. 2.
Download original image
NGC 1300. Left panel: Images of the F814W filter of HST (a, b), and Legacy Z band (c, d). Middle and right panels: ALMA data (mean flux and velocity map) associated with each FOV, as described in section 3. The orientation N–E is north up and east right. The cross (arbitrary size) indicates the centre of the image, which was taken from the emission peak from the infrared image and was used to match the ALMA images.
Current usage metrics show cumulative count of Article Views (full-text article views including HTML views, PDF and ePub downloads, according to the available data) and Abstracts Views on Vision4Press platform.
Data correspond to usage on the plateform after 2015. The current usage metrics is available 48-96 hours after online publication and is updated daily on week days.
Initial download of the metrics may take a while.