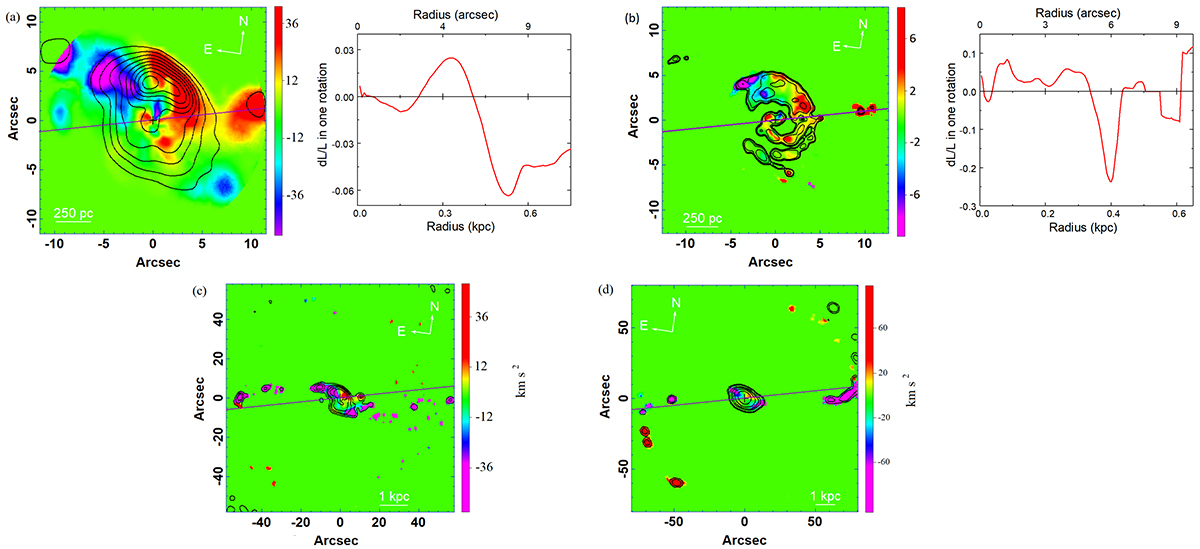
Fig. 13.
Download original image
NGC 1300 torque maps from the same set of data as in panel (a) Fig. 2a, (b) Fig. 2b, (c) Fig. 2c, and (d) Fig. 2d. The images were rotated and de-projected. The orientation N–E is indicated in the torque maps. The crosses represent the centre of the galaxy estimated from the emission peaks of the infrared images and ALMA data. The dark violet line represents the PA of the bar after rotation. Each map is associated with a graph that represents the radial distribution of the torque, averaged over the azimuth, and normalised to the angular momentum, per rotation at this radius. The colour scales in the maps are in arbitrary units (except for panels c and d), of the torques t(x,y) weighted by the gas surface density Σ(x,y). The contours of Σ(x,y) are from the mean molecular gas map (a) one to nine times 18.55 Jy/beam km/s, (b) 1, 1.1, 1.4, 2.5, 5.9, 16.5 times 0.3 Jy/beam km/s (c) 1, 5, 11, 23.8, 51.5 times 1.65 Jy/beam km/s, and (d) 1, 2.5, 12.5, 27.2, 58.9, 127.2 times 0.49 Jy/beam km/s. The velocities are relative to the centre.
Current usage metrics show cumulative count of Article Views (full-text article views including HTML views, PDF and ePub downloads, according to the available data) and Abstracts Views on Vision4Press platform.
Data correspond to usage on the plateform after 2015. The current usage metrics is available 48-96 hours after online publication and is updated daily on week days.
Initial download of the metrics may take a while.