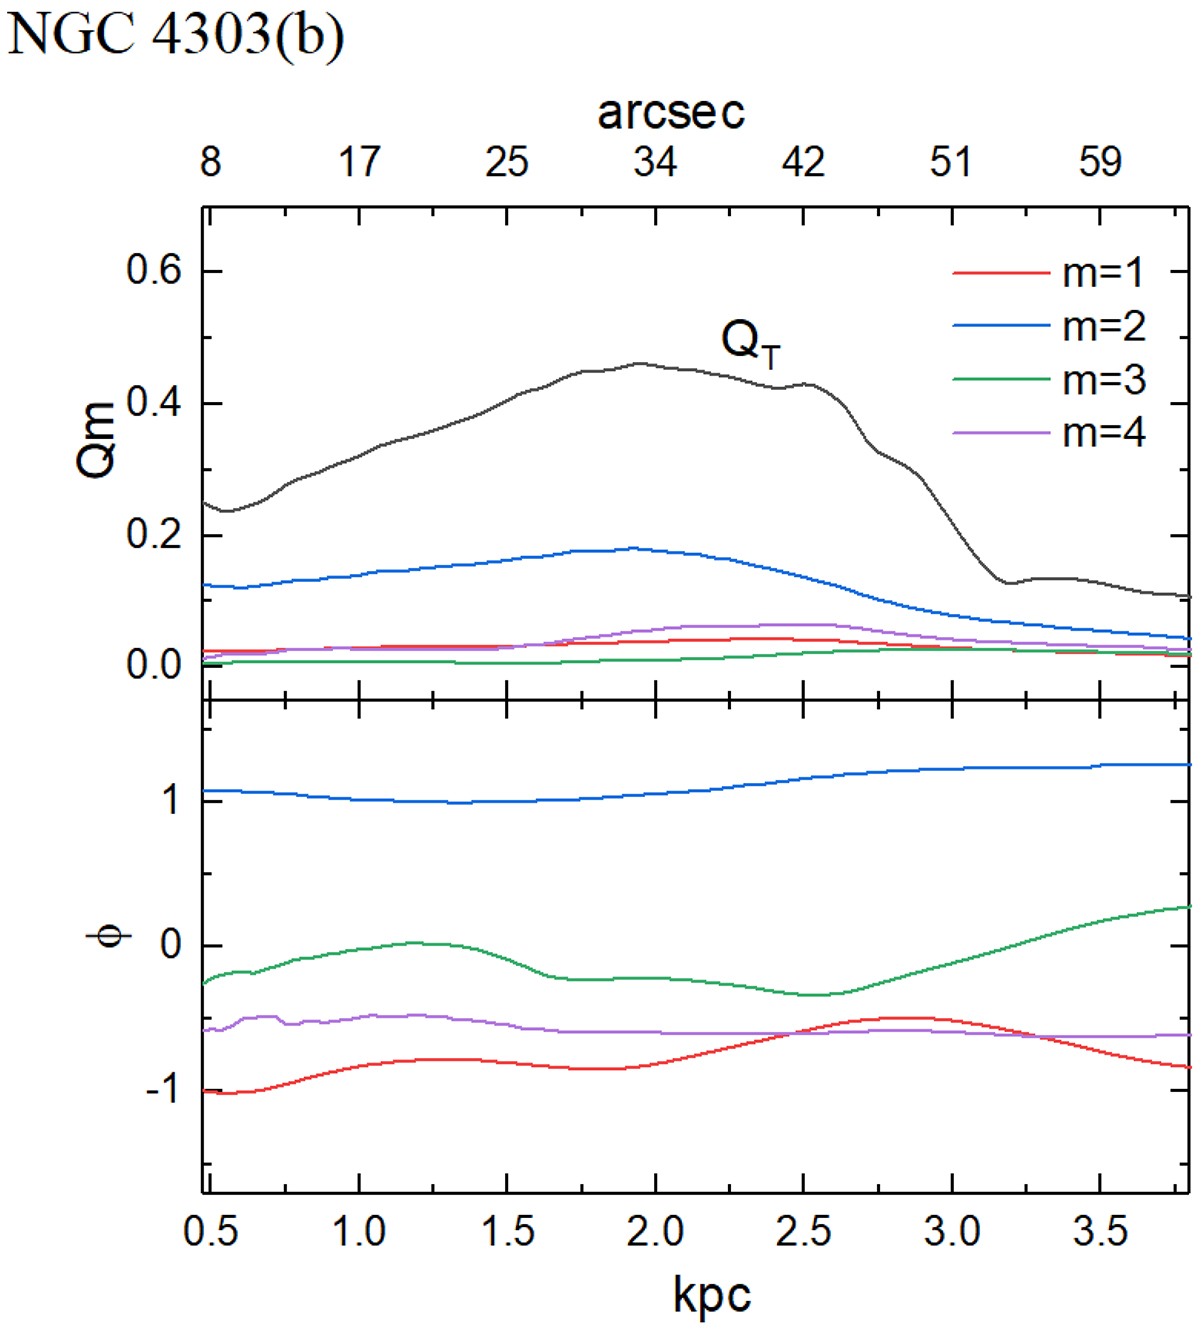
Fig. 12.
Download original image
Radial distribution of the amplitudes (top) and phases (bottom) of the non-axisymmetric perturbations in each Fourier component (m = 1 to 4). QT represents the total perturbation curve in the potential for the data set of N4303 (b). This plot illustrates the typical potential component curves obtained in the sample. The maximum values of the Q2 and QT curves are shown in Table 3.
Current usage metrics show cumulative count of Article Views (full-text article views including HTML views, PDF and ePub downloads, according to the available data) and Abstracts Views on Vision4Press platform.
Data correspond to usage on the plateform after 2015. The current usage metrics is available 48-96 hours after online publication and is updated daily on week days.
Initial download of the metrics may take a while.