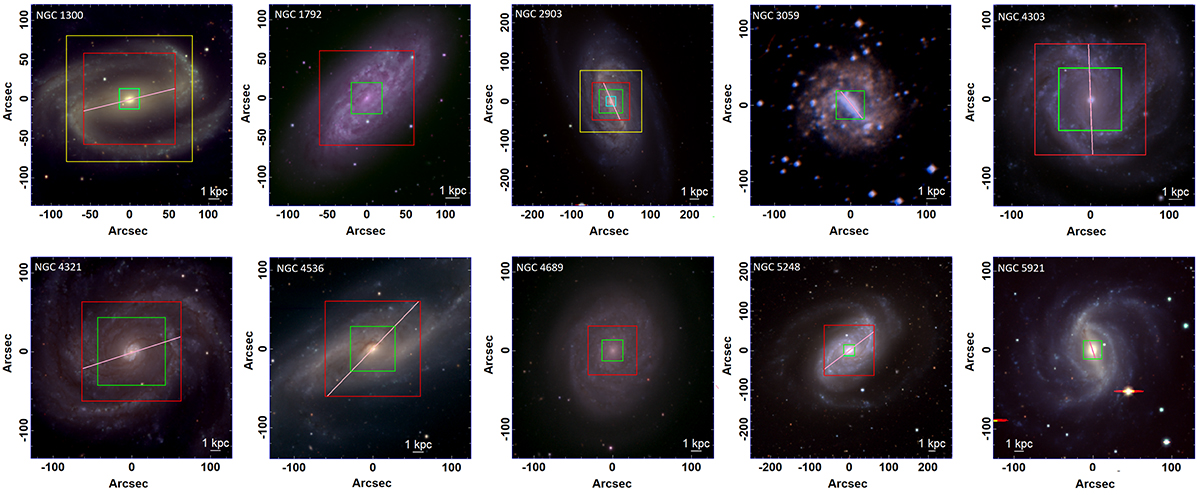
Fig. 1.
Download original image
Composite of Legacy images of the G (blue), R (green), and Z (red) bands (except for NGC 3059, which lacks Legacy images; in this case, we used the images from the Digitalized Sky Survey). The squares represent the size of the FOV that was used for each data set: green for HST and ALMA, cyan for the HST and the ALMA high spatial resolution set, red for Legacy and ALMA, and yellow for the Legacy and ALMA larger FOV (combination of two FOVs). The pink lines represent the PA of the bar. The orientation N–E is north up and east left.
Current usage metrics show cumulative count of Article Views (full-text article views including HTML views, PDF and ePub downloads, according to the available data) and Abstracts Views on Vision4Press platform.
Data correspond to usage on the plateform after 2015. The current usage metrics is available 48-96 hours after online publication and is updated daily on week days.
Initial download of the metrics may take a while.