Fig. 9.
Download original image
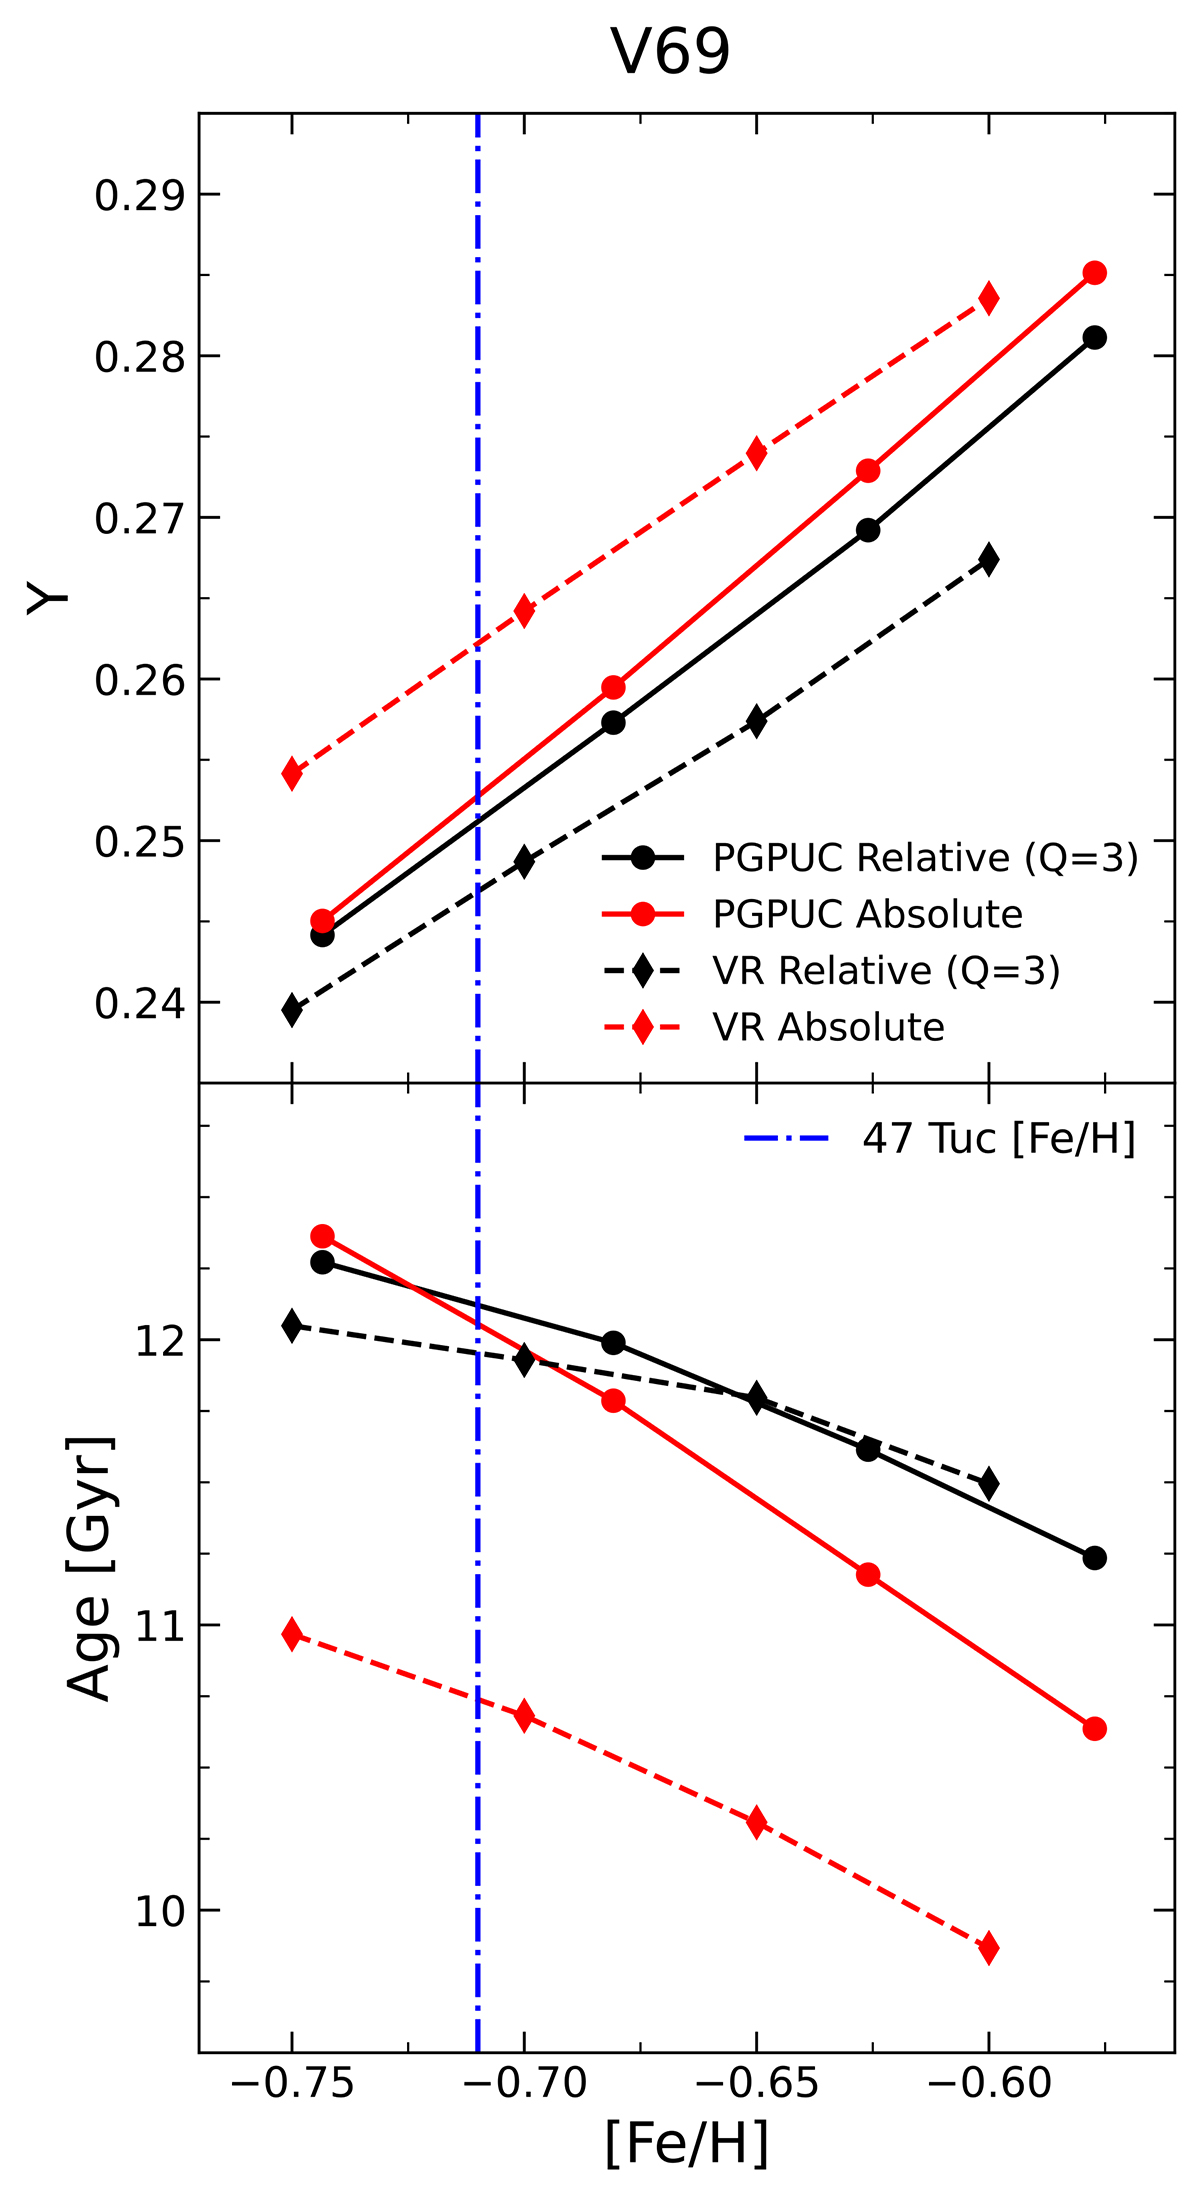
He abundance (upper panel) and age (lower panel) as a function of [Fe/H] for the relative (black lines) and absolute (red lines) approaches, using PGPUC (solid lines) and VR (dashed lines) models. These calculations use [α/Fe]= + 0.4. The assumed [Fe/H] value of V69 is depicted as a dash-dotted blue line. The errors for each Y and age estimation are not included, as they are discussed in Sect. 4.5.
Current usage metrics show cumulative count of Article Views (full-text article views including HTML views, PDF and ePub downloads, according to the available data) and Abstracts Views on Vision4Press platform.
Data correspond to usage on the plateform after 2015. The current usage metrics is available 48-96 hours after online publication and is updated daily on week days.
Initial download of the metrics may take a while.