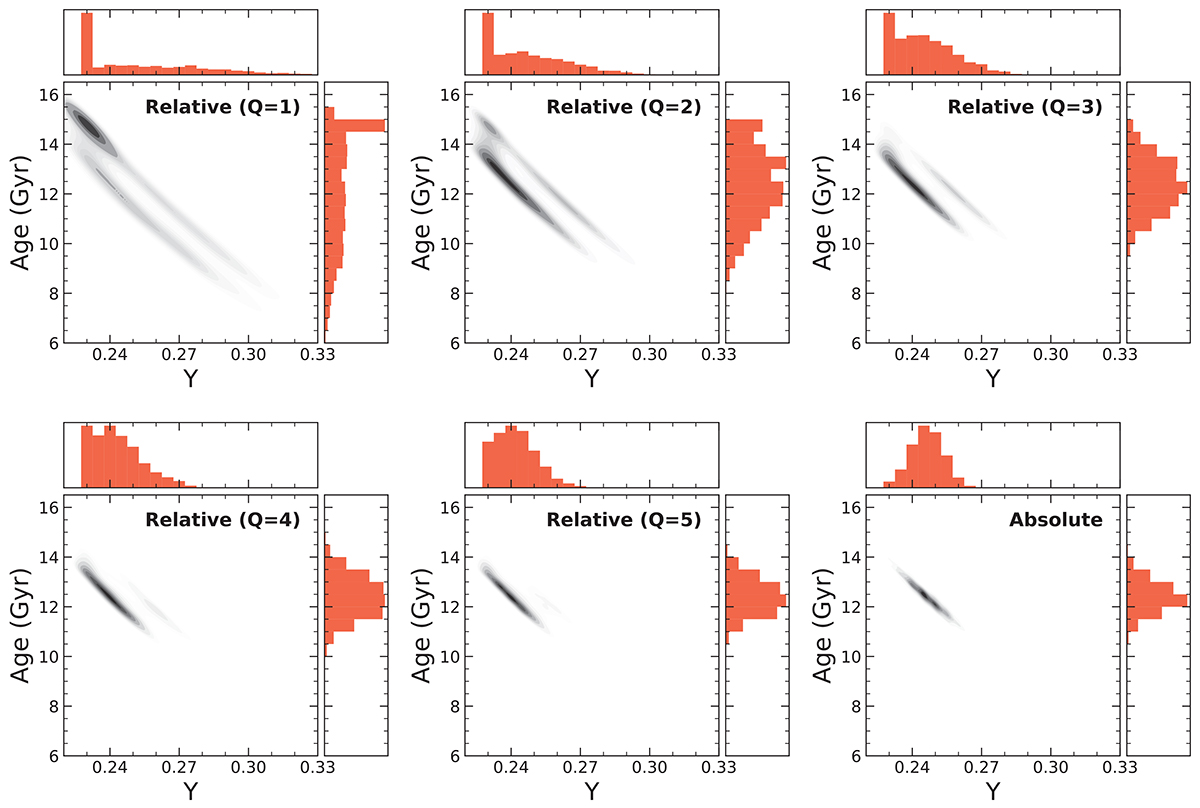
Fig. 7.
Download original image
Contour plot of the Y − age distributions obtained in the MC instances. In the relative case, the distributions were obtained assuming increasing Q values, from Q = 1 (upper left) to Q = 5 (bottom middle). The absolute case is depicted in the bottom-right panel. In all cases, PGPUC models with Z = 0.006 were used. Y and age histograms are included in each panel.
Current usage metrics show cumulative count of Article Views (full-text article views including HTML views, PDF and ePub downloads, according to the available data) and Abstracts Views on Vision4Press platform.
Data correspond to usage on the plateform after 2015. The current usage metrics is available 48-96 hours after online publication and is updated daily on week days.
Initial download of the metrics may take a while.