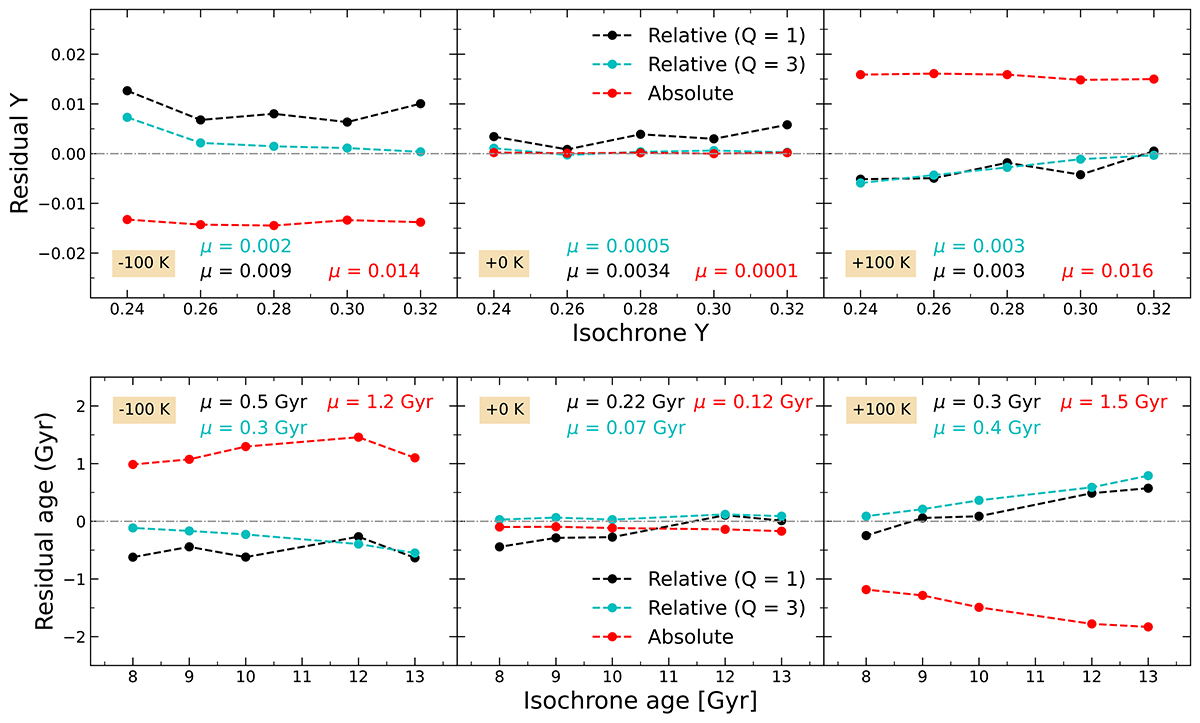
Fig. 6.
Download original image
Residuals obtained in Y (upper panels) and age (lower panels) when testing our methodology with synthetic TO stars (see Sect. 4.6). Tests with decreased temperatures are shown in the left panels, while those with unchanged and increased temperatures are shown in the middle and right panels, respectively. Red symbols represent the absolute approach, whereas the relative approach is indicated with black (propagated nominal errors) and cyan (errors reduced by a factor Q = 3) symbols, respectively. Additionally, the mean values of the residuals are shown in their respective panel, with the corresponding color for each approach. These mean values are obtained using the absolute values of the residuals. The errors in each Y and age estimation are not shown here, as they are discussed in Sect. 4.5.
Current usage metrics show cumulative count of Article Views (full-text article views including HTML views, PDF and ePub downloads, according to the available data) and Abstracts Views on Vision4Press platform.
Data correspond to usage on the plateform after 2015. The current usage metrics is available 48-96 hours after online publication and is updated daily on week days.
Initial download of the metrics may take a while.