Open Access
Fig. 4.
Download original image
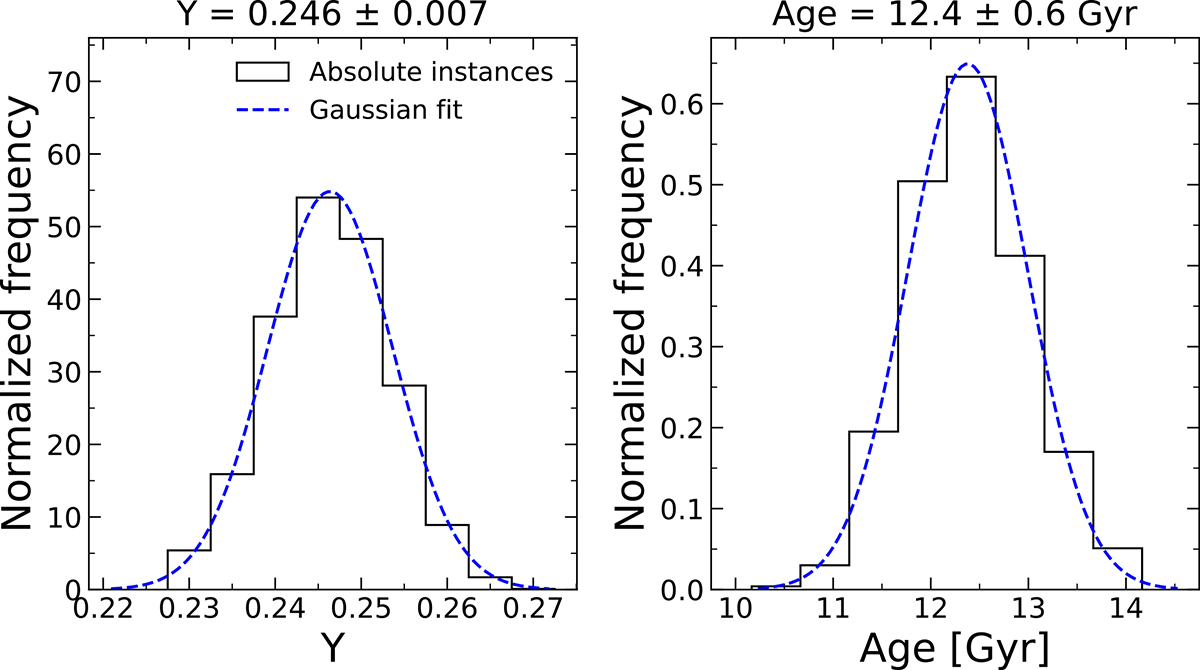
Y (left) and age (right) distributions across 2000 MC instances, using absolute PGPUC tracks with Z = 0.006. The best-fitting Gaussian distributions are shown as dashed blue lines, with their mean and standard deviation displayed in the title of the panels.
Current usage metrics show cumulative count of Article Views (full-text article views including HTML views, PDF and ePub downloads, according to the available data) and Abstracts Views on Vision4Press platform.
Data correspond to usage on the plateform after 2015. The current usage metrics is available 48-96 hours after online publication and is updated daily on week days.
Initial download of the metrics may take a while.