Fig. B.1.
Download original image
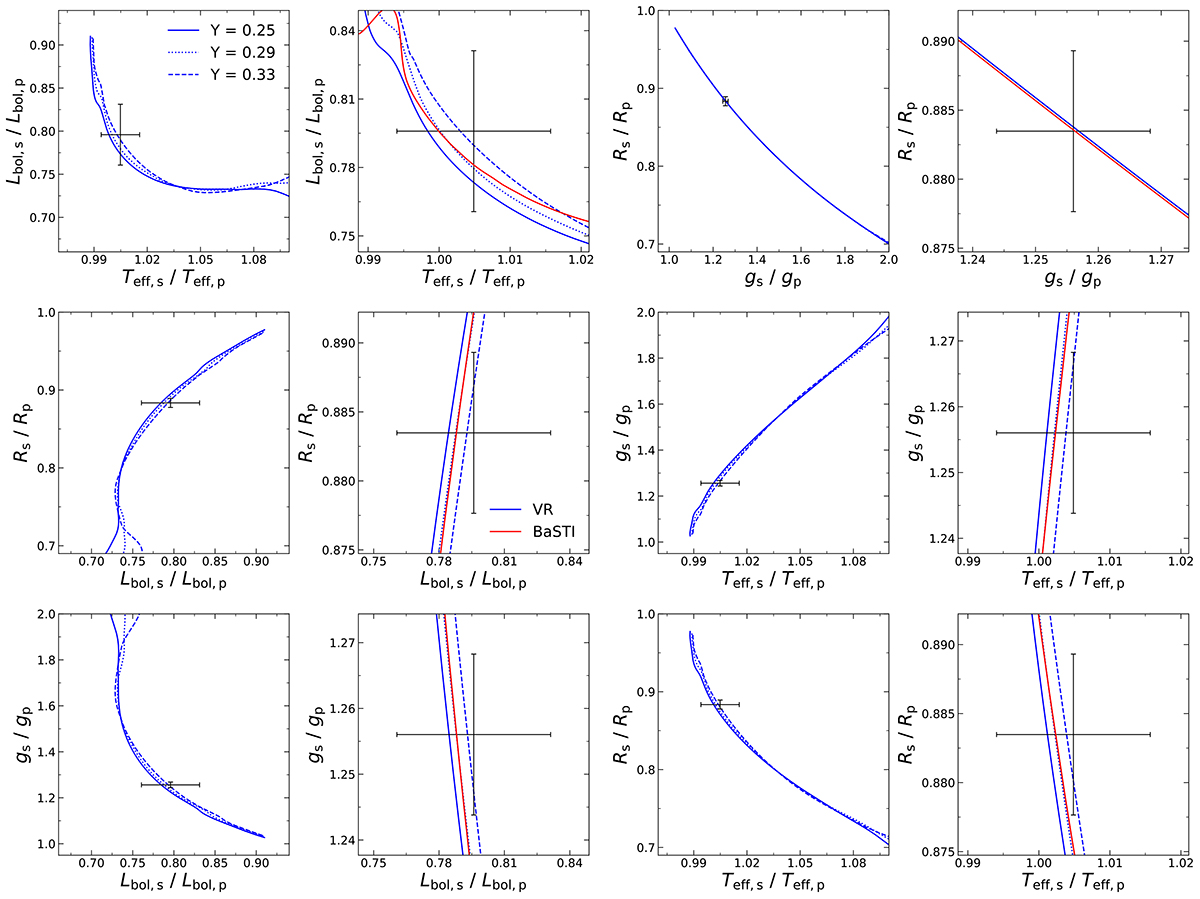
Similar to Fig. 1, but displaying ratios of parameters, instead of the absolute ones, for different combinations of Lbol, s/Lbol, p, Rs/Rp, gs/gp, and Teff, s/Teff, p. The nominal masses and other empirical parameters of V69’s components are the same as listed in Table 1; since the absolute mass values are fixed, tracks for different Y values have different TO ages, as also happens in the case of Fig. 2. The first and third columns show the same evolutionary stages as those covered by the relative tracks presented in Fig. 2. The second and fourth columns are zoomed-in plots corresponding to the first and third columns, respectively. In each panel, solid, dotted, and dashed blue lines correspond to VR tracks for Y = 0.25, 0.29, and 0.33, respectively (Table 2), whereas red tracks in the zoomed-in plots correspond to BaSTI tracks with Y = 0.255, Z = 0.006. In this case, we only show VR tracks (for easier viewing), but the PGPUC models show the same behavior. The points with error bars correspond to the empirical parameters derived for V69 from the empirical data (Table 1), with the error bars propagated from the absolute values.
Current usage metrics show cumulative count of Article Views (full-text article views including HTML views, PDF and ePub downloads, according to the available data) and Abstracts Views on Vision4Press platform.
Data correspond to usage on the plateform after 2015. The current usage metrics is available 48-96 hours after online publication and is updated daily on week days.
Initial download of the metrics may take a while.