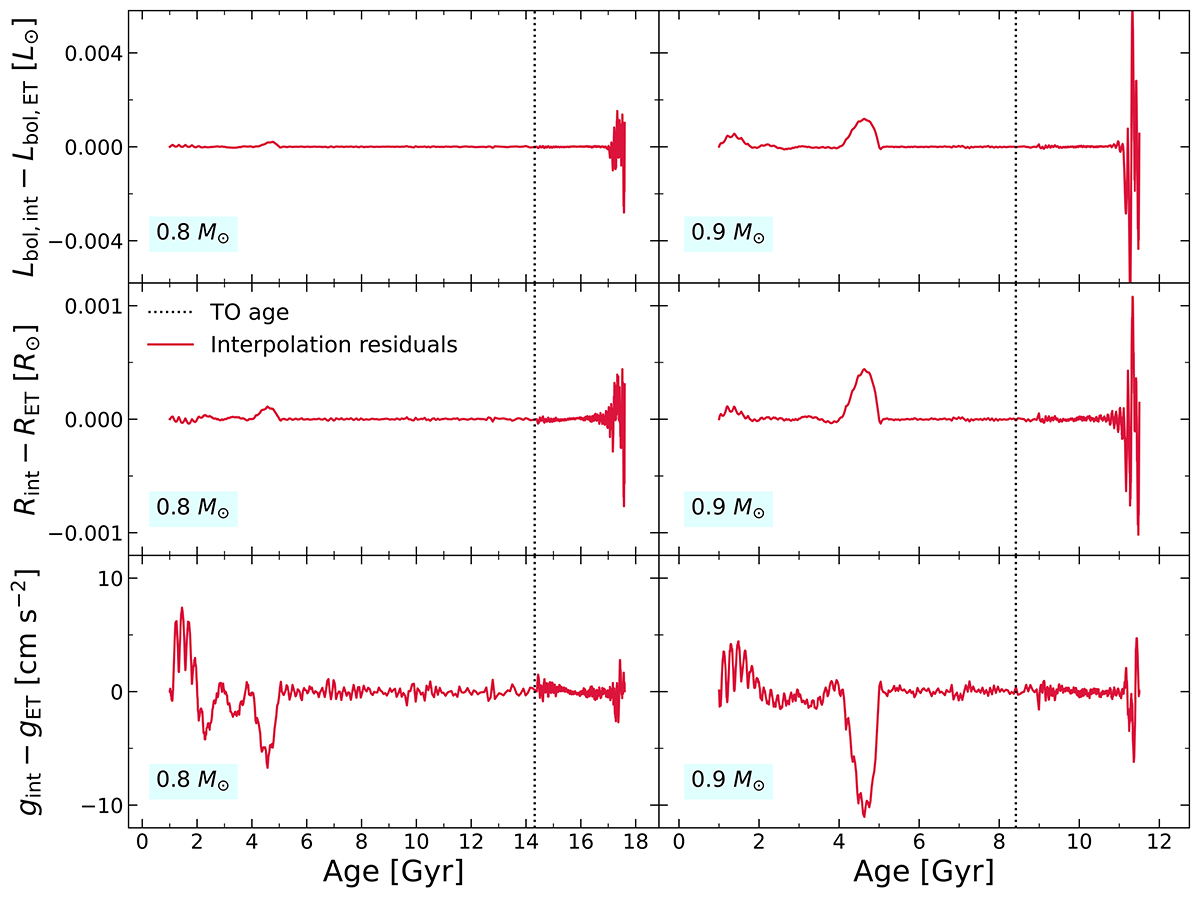
Fig. A.1.
Download original image
Residuals of the VR interpolations in Lbol (upper panels), R (middle panels), and g (lower panels) as a function of the evolutionary age. The tracks were computed with a chemical composition described by Y = 0.25, [α/Fe] = 0.3, and [Fe/H] = 0.7 and correspond to masses of 0.8 M⊙ (left panels) and 0.9 M⊙ (right panels). The evolutionary ages shown cover the evolution of the star up until the base of the RGB. The TO age of the tracks is shown in each panel as a vertical dotted line.
Current usage metrics show cumulative count of Article Views (full-text article views including HTML views, PDF and ePub downloads, according to the available data) and Abstracts Views on Vision4Press platform.
Data correspond to usage on the plateform after 2015. The current usage metrics is available 48-96 hours after online publication and is updated daily on week days.
Initial download of the metrics may take a while.