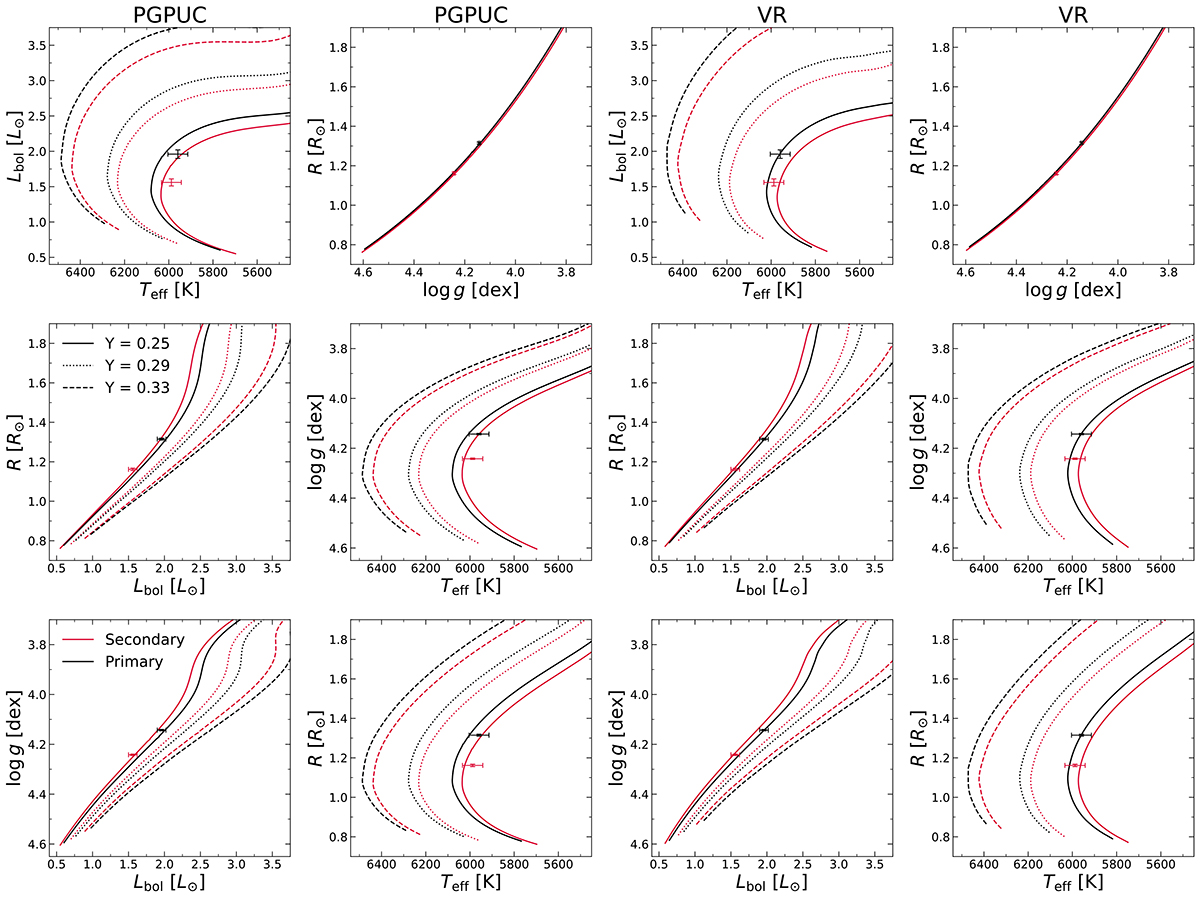
Fig. 1.
Download original image
Evolutionary tracks from PGPUC (first and second columns) and VR (third and fourth columns) with the nominal masses of V69’s components (from Table 1; red tracks correspond to the secondary, while black tracks correspond to the primary), compared with the observations (Table 1) of the binary. Solid, dotted, and dashed lines correspond to Y = 0.25, Y = 0.29, and Y = 0.33, respectively. All models were computed with [α/Fe] = 0.3. The VR tracks have [Fe/H] = −0.7, while the PGPUC tracks have Z = 0.0057, which at Y = 0.25 corresponds to [Fe/H] = −0.7. The VR tracks are interpolated following the procedure explained in Appendix A.
Current usage metrics show cumulative count of Article Views (full-text article views including HTML views, PDF and ePub downloads, according to the available data) and Abstracts Views on Vision4Press platform.
Data correspond to usage on the plateform after 2015. The current usage metrics is available 48-96 hours after online publication and is updated daily on week days.
Initial download of the metrics may take a while.