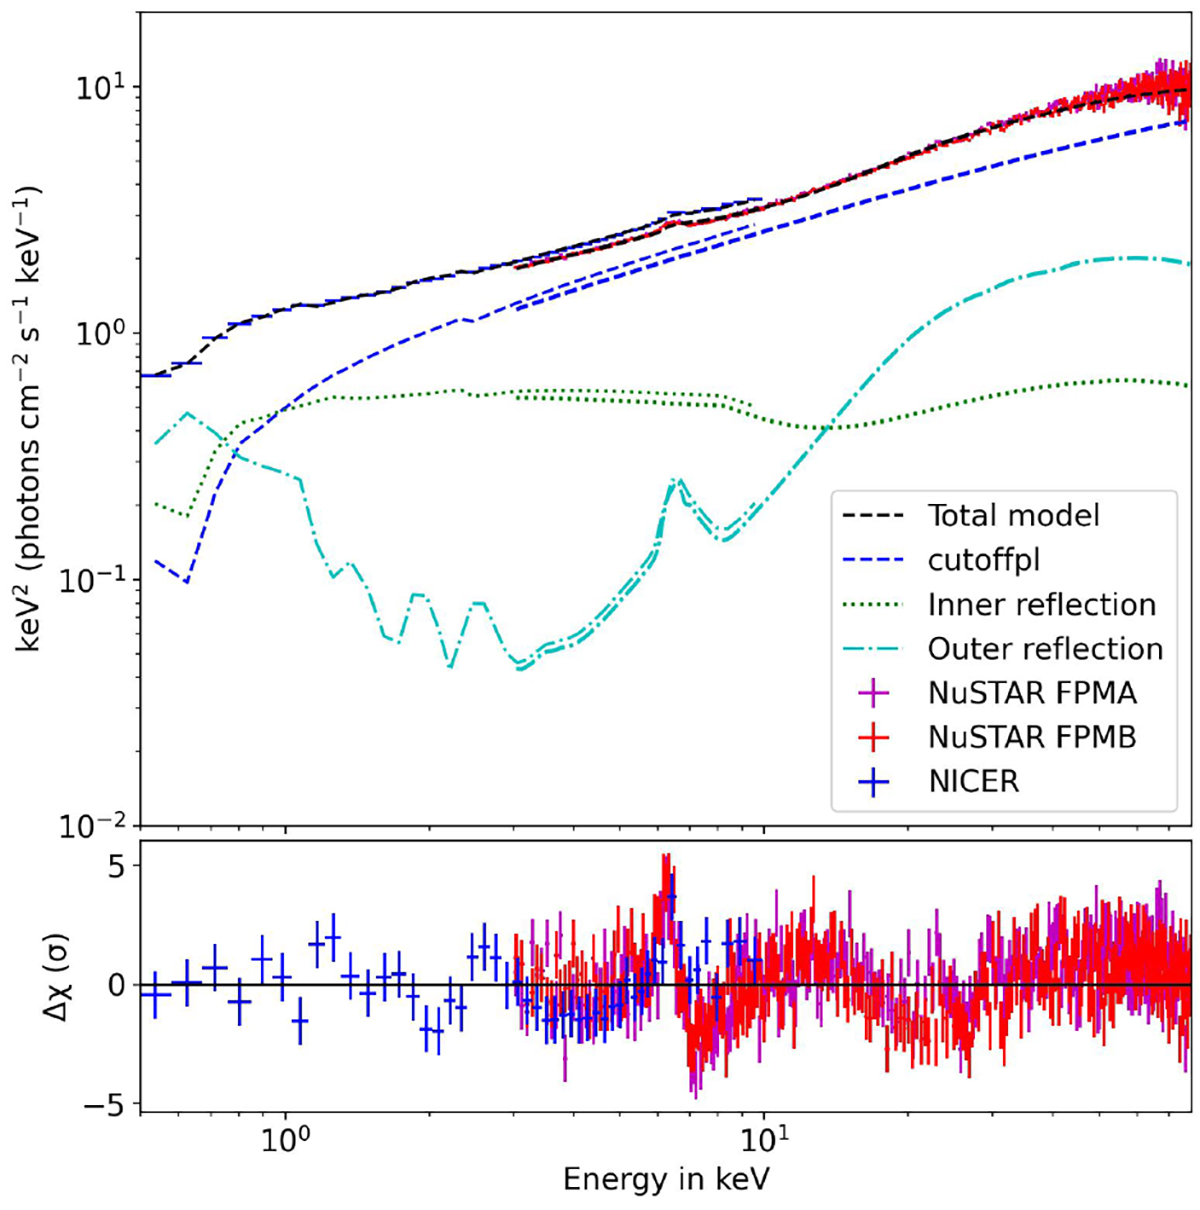
Fig. B.1.
Download original image
Spectral fit for NuSTAR FPMA (magenta), NuSTAR FPMB (red) and NICER (blue) with model B.2. Top panel shows the unfolded spectra and bottom panel shows the data residuals. Although residuals indicate that this is not a perfectly fitted iron line, the reprocessed blackbody remain sufficient and consistent to fit the data from NICER along with NuSTAR. The fitted model parameters are presented in Table B.1. Data is rebinned using the command “setplot rebin 100 10” to present in the plot.
Current usage metrics show cumulative count of Article Views (full-text article views including HTML views, PDF and ePub downloads, according to the available data) and Abstracts Views on Vision4Press platform.
Data correspond to usage on the plateform after 2015. The current usage metrics is available 48-96 hours after online publication and is updated daily on week days.
Initial download of the metrics may take a while.