Fig. 1
Download original image
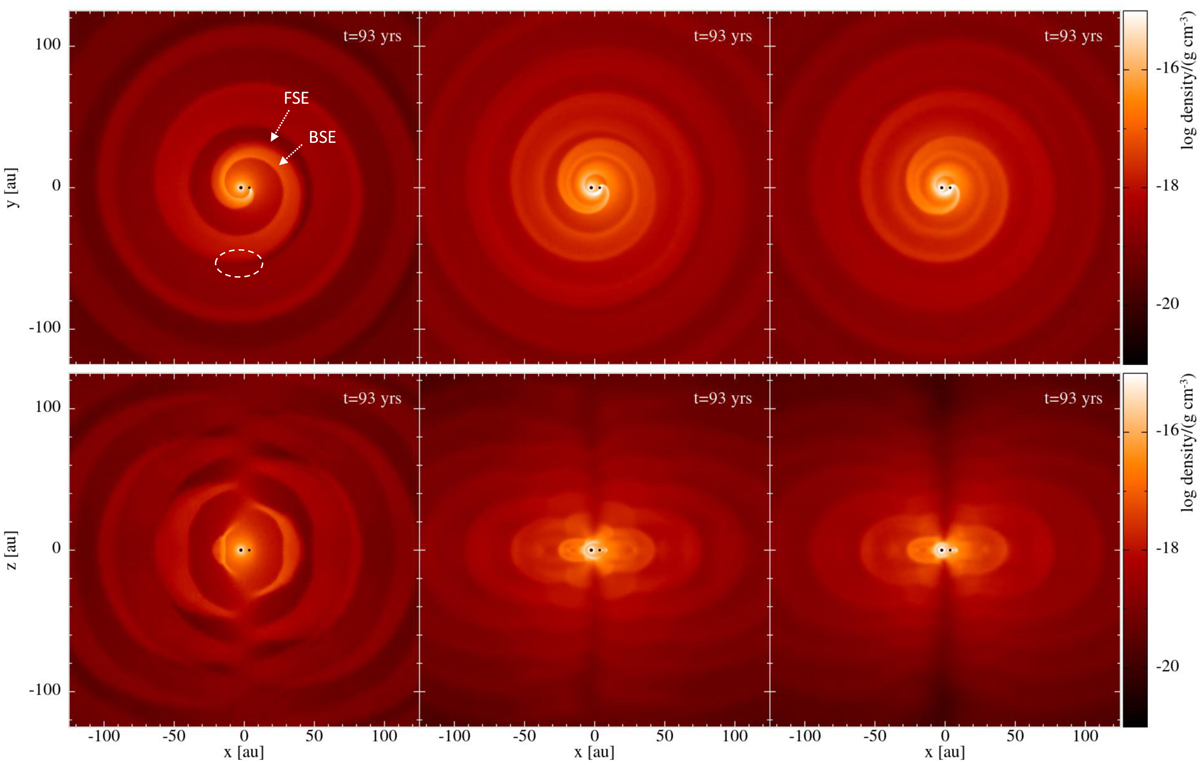
Density profile in a slice through (top row) and perpendicular to (bottom row) the orbital plane of binary models v20e00 (left), v10e00 (middle), and v05e00 (right) at the end of the simulation (t = 93 yr), with log = (log10). The AGB and companion star are marked as the left and right dot, respectively, not to scale. In the upper left panel, the ‘backward spiral edge’ (BSE), the ‘frontward spiral edge’ (FSE), and the location where they merge into one spiral structure are indicated. A version without H I cooling is presented in Fig. 1 in Paper I.
Current usage metrics show cumulative count of Article Views (full-text article views including HTML views, PDF and ePub downloads, according to the available data) and Abstracts Views on Vision4Press platform.
Data correspond to usage on the plateform after 2015. The current usage metrics is available 48-96 hours after online publication and is updated daily on week days.
Initial download of the metrics may take a while.