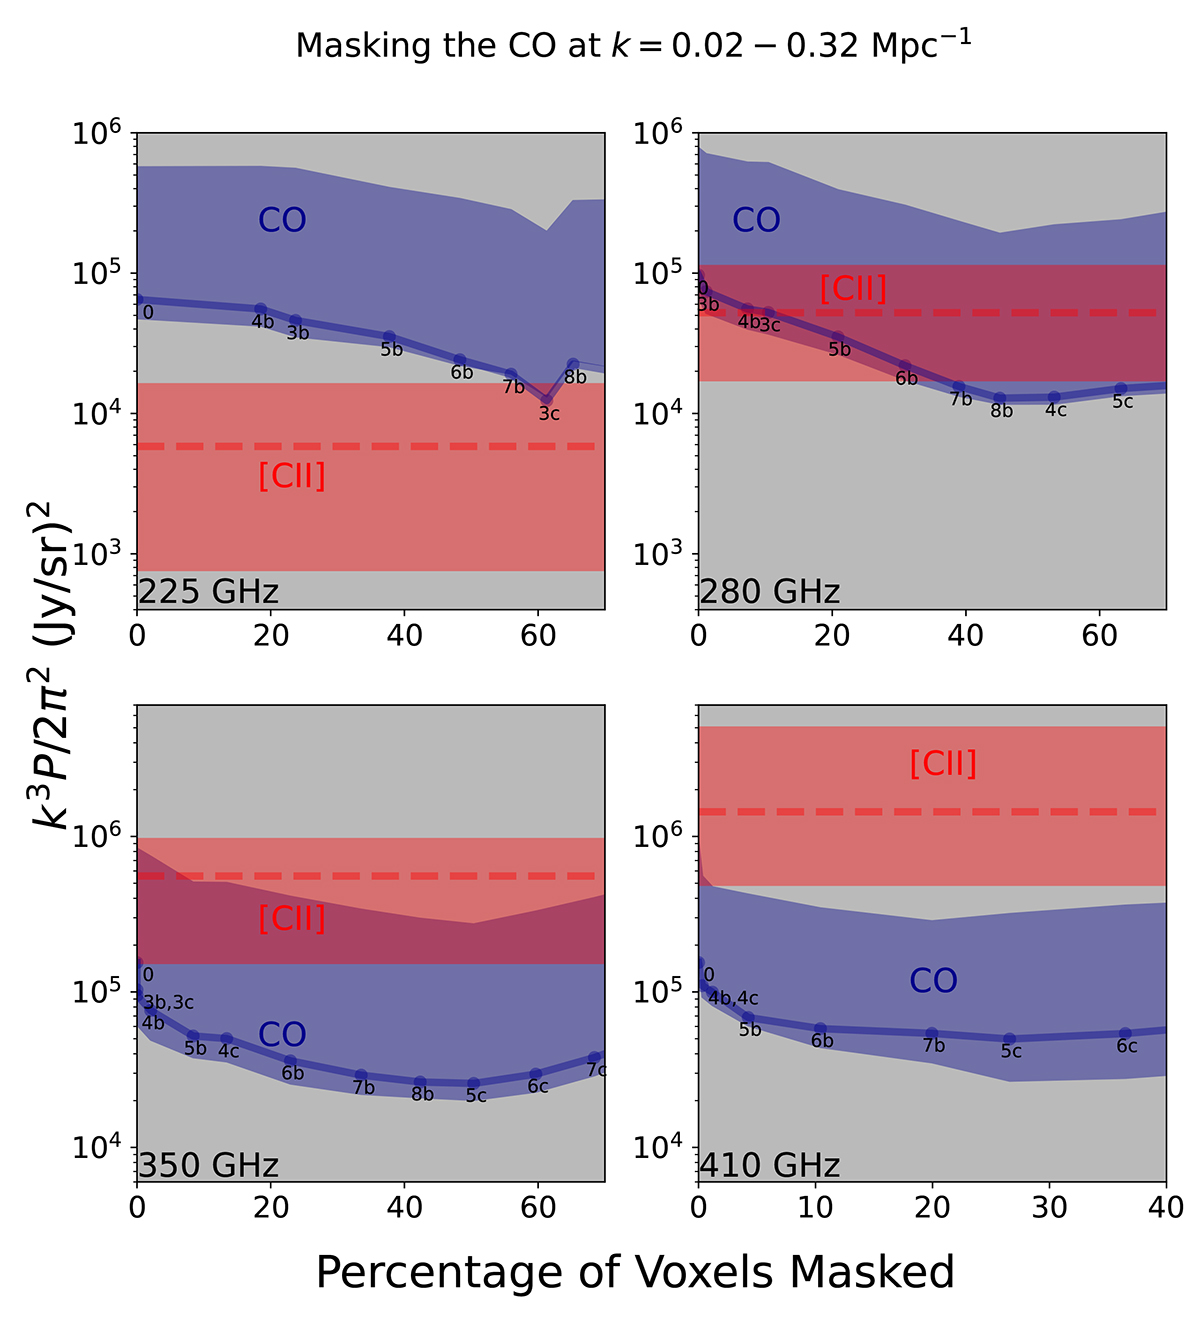
Fig. 9.
Download original image
Effect of masking on the CO-only PS. The range of PS between the “low-contamination” and “high-contamination” models (Sect. 2.3.2) at k = 0.02 − 0.32 Mpc−1 for CO lines (blue) is shown in relation to the percentage of voxels masked within the LIM tomographies for the frequency ranges of 225 ± 40 GHz (associated with z[CII] = 7.4), 280 ± 40 GHz (z[CII] = 5.8), 350 ± 40 GHz (z[CII] = 4.3), and 410 ± 40 GHz (z[CII] = 3.7). The lines represent the optimal CO masking sequence for our fiducial model, while each point and label indicate the Jup and subsample (“b” for “bright” and “c” for “complete”) associated with the masking array applied. The same masking sequence is applied to the “low-contamination” and “high-contamination” models (Sect. 4.2.1). As an illustration and assuming at this stage that the mask does not affect the [CII] PS (but see Sect. 4.2.2), we show the fiducial and range of [CII] PS predictions in red.
Current usage metrics show cumulative count of Article Views (full-text article views including HTML views, PDF and ePub downloads, according to the available data) and Abstracts Views on Vision4Press platform.
Data correspond to usage on the plateform after 2015. The current usage metrics is available 48-96 hours after online publication and is updated daily on week days.
Initial download of the metrics may take a while.