Open Access
Fig. 5.
Download original image
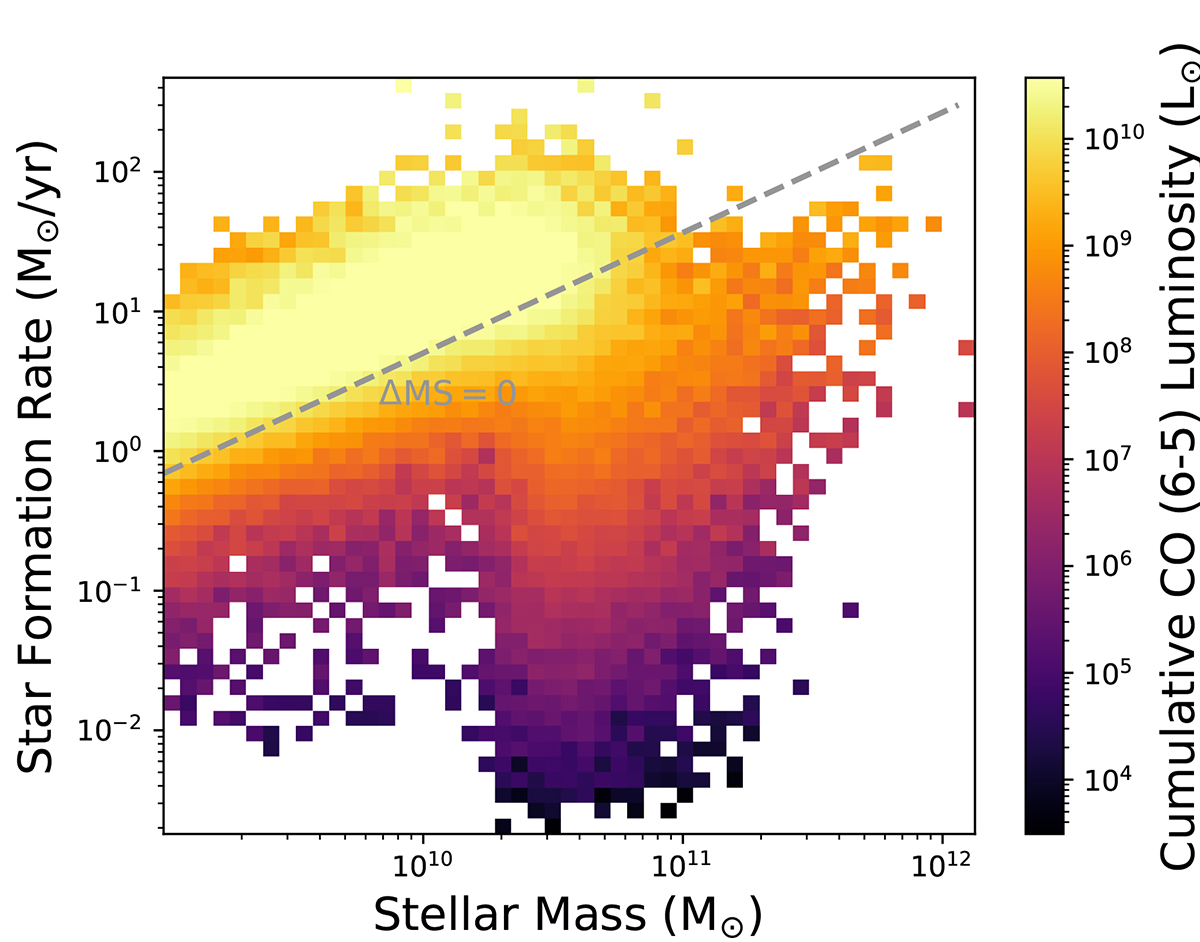
SFR as a function of stellar mass with the bins color-coded to reflect the cumulative CO (6−5) luminosity of the 2D bin. The dashed line indicates the thresholds that define our “bright” subsample with ΔMS > 0 (i.e., galaxies on and above the MS).
Current usage metrics show cumulative count of Article Views (full-text article views including HTML views, PDF and ePub downloads, according to the available data) and Abstracts Views on Vision4Press platform.
Data correspond to usage on the plateform after 2015. The current usage metrics is available 48-96 hours after online publication and is updated daily on week days.
Initial download of the metrics may take a while.