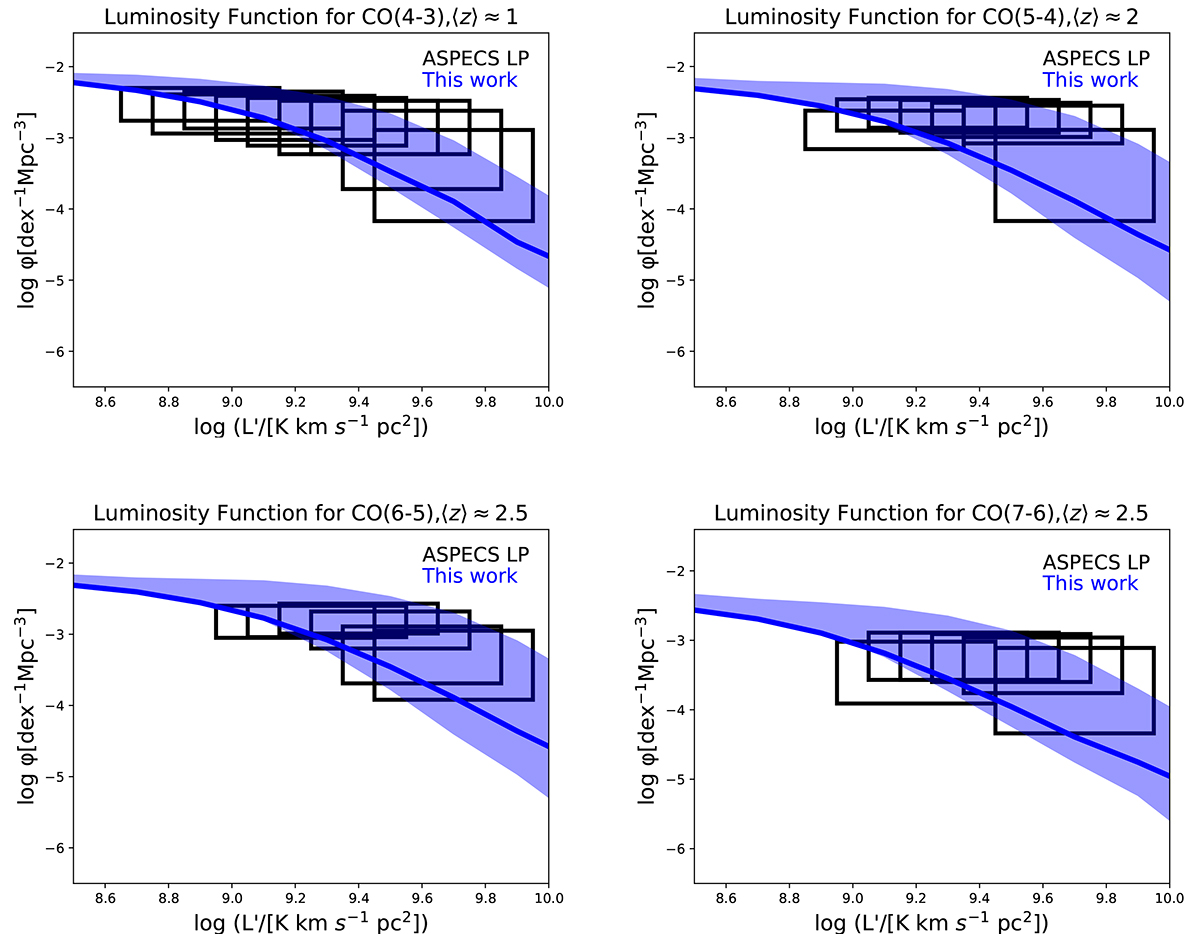
Fig. 3.
Download original image
CO luminosity function for various transitions and redshifts. The blue line corresponds to our fiducial model, while the shaded region indicates the range resulting from our optimistic and pessimistic models. Rectangles represent observational data from the ASPECS LP survey (Decarli et al. 2020), with the width indicating the bin size and the height indicating the 1-σ confidence region.
Current usage metrics show cumulative count of Article Views (full-text article views including HTML views, PDF and ePub downloads, according to the available data) and Abstracts Views on Vision4Press platform.
Data correspond to usage on the plateform after 2015. The current usage metrics is available 48-96 hours after online publication and is updated daily on week days.
Initial download of the metrics may take a while.