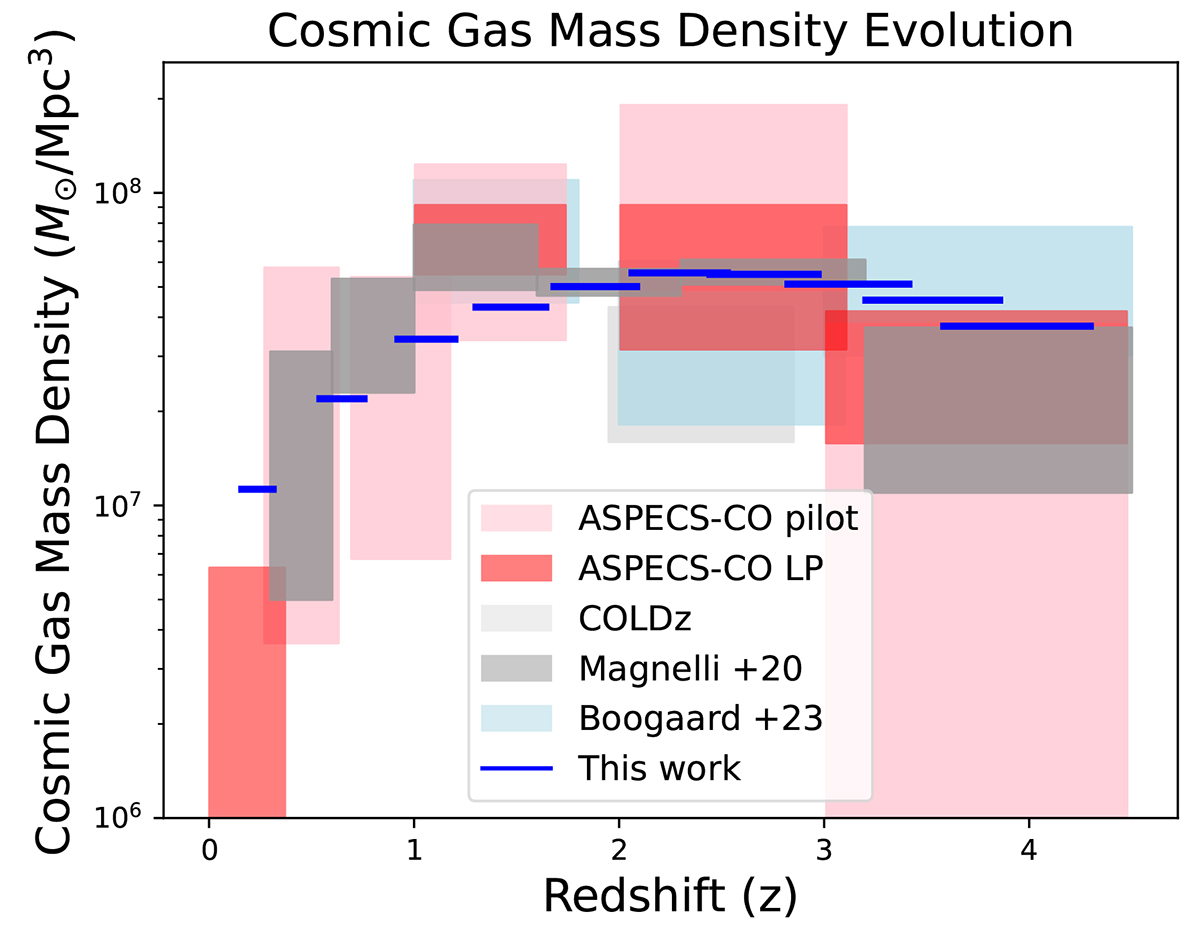
Fig. 2.
Download original image
Redshift evolution of the cosmic molecular gas mass density of galaxies. The blue horizontal line represents predictions from our cone of mock galaxies, while observational constraints are presented by rectangles. The gray rectangles are for the dust-based estimates of Magnelli et al. (2020), the light gray rectangles are for the COLDz CO survey (Riechers et al. 2019), the light blue rectangle for the CO-based estimates of Boogaard et al. (2023), the red-shaded rectangles are for the ASPECS CO pilot survey (Decarli et al. 2020), while the pink rectangles are for the ASPECS CO LP survey (Decarli et al. 2020). The width of the rectangles indicates the redshift bin size and the height the 1-σ confidence region.
Current usage metrics show cumulative count of Article Views (full-text article views including HTML views, PDF and ePub downloads, according to the available data) and Abstracts Views on Vision4Press platform.
Data correspond to usage on the plateform after 2015. The current usage metrics is available 48-96 hours after online publication and is updated daily on week days.
Initial download of the metrics may take a while.