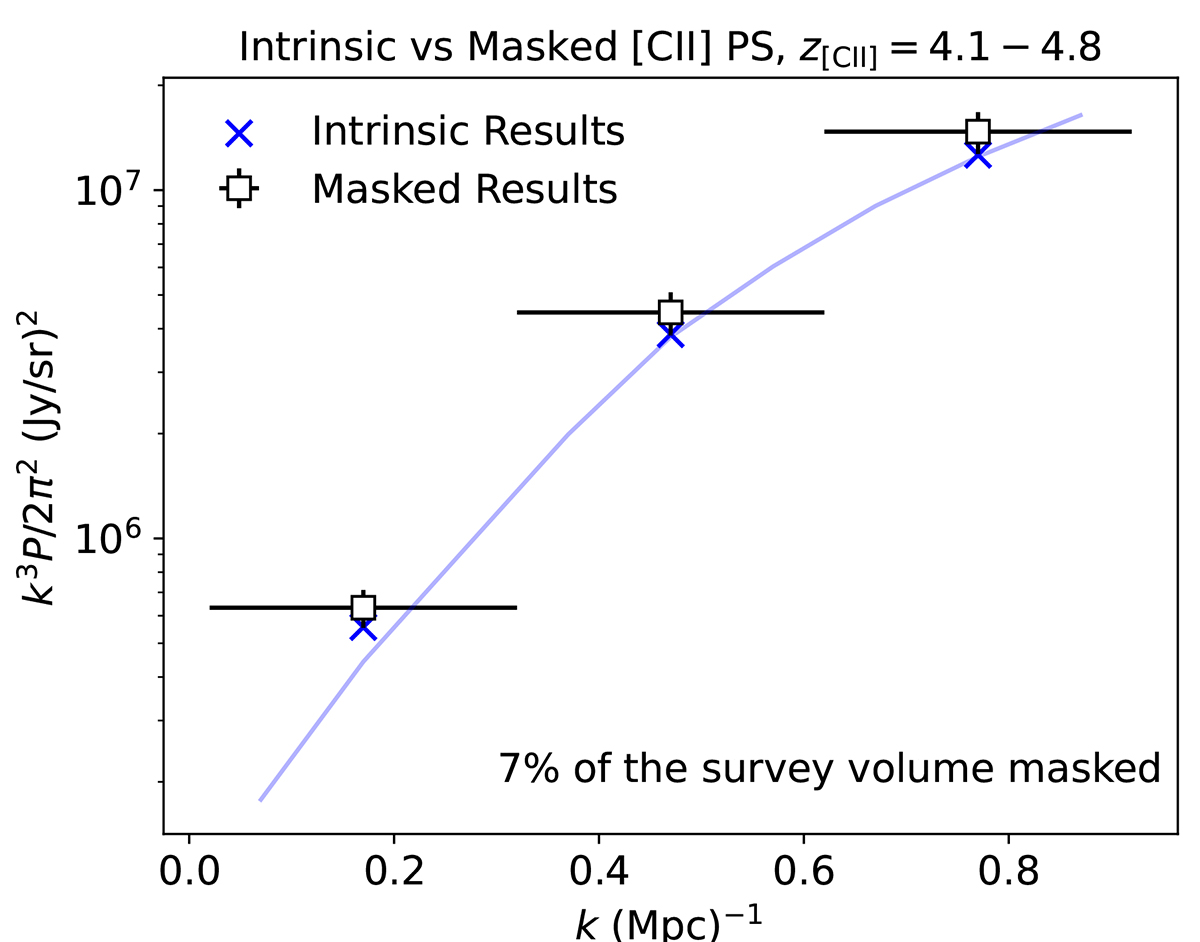
Fig. 13.
Download original image
Comparison of the [CII] PS for [CII] observations in the redshift range z[CII] = 4.1 − 4.8. The squares denote the combined CO+[CII] PS after masking CO bright voxels, resulting in a 7% reduction in survey volume. The associated error bars on the squares capture the uncertainty in [CII] measurements due to white instrumental noise and sample variance. The blue crosses depict the intrinsic [CII] PS results, binned at the same Δk. The continuous line represents the intrinsic [CII] PS results but with a finer binning.
Current usage metrics show cumulative count of Article Views (full-text article views including HTML views, PDF and ePub downloads, according to the available data) and Abstracts Views on Vision4Press platform.
Data correspond to usage on the plateform after 2015. The current usage metrics is available 48-96 hours after online publication and is updated daily on week days.
Initial download of the metrics may take a while.