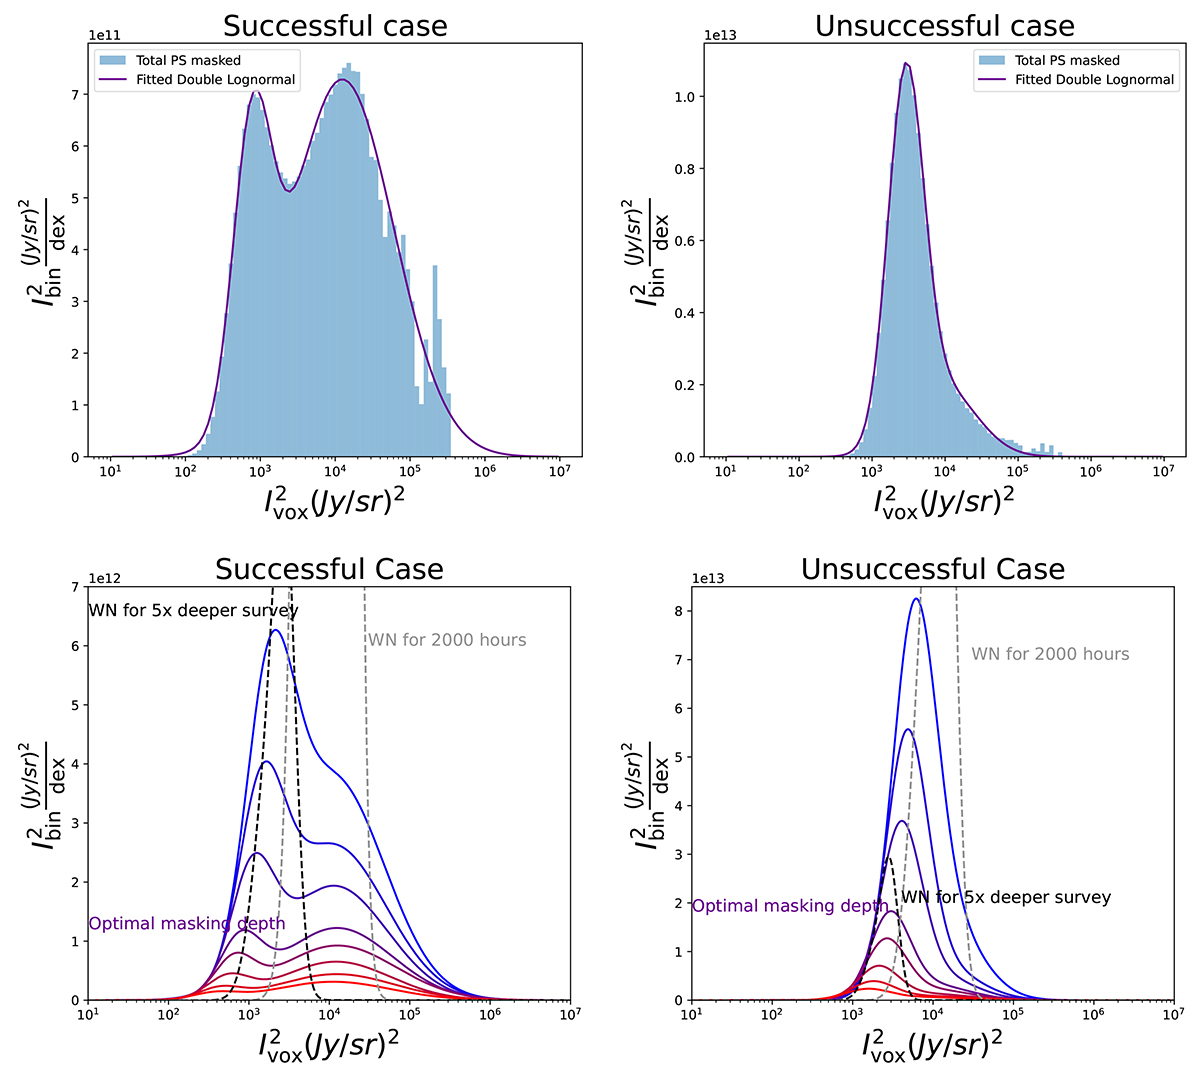
Fig. 12.
Download original image
Pixel distribution histograms weighted with the voxel intensity squared, illustrating the distinction between successful (left; fiducial CO) and unsuccessful (right; pessimistic CO) cases of CO masking of the FYST 280 ± 20 GHz tomography. The top panels show the weighted voxel histograms of these 280 ± 20 GHz tomography masked to the optimal depth and fitted double lognormal distributions. The lower panels detail the progressive masking depth, each curve representing the lognormal fits of the weighted histogram at increasing depth. This highlights the emergence of a bimodal distribution in the successful case versus a single peak distribution in the unsuccessful case. The lognormal fit to the weighted histogram of a white noise tomography equivalent to the upcoming 2000 hours FYST LIM (black dashed line) and a fit to the white noise tomography of a survey 5 times deeper (gray dashed line) are superimposed.
Current usage metrics show cumulative count of Article Views (full-text article views including HTML views, PDF and ePub downloads, according to the available data) and Abstracts Views on Vision4Press platform.
Data correspond to usage on the plateform after 2015. The current usage metrics is available 48-96 hours after online publication and is updated daily on week days.
Initial download of the metrics may take a while.