Fig. 7.
Download original image
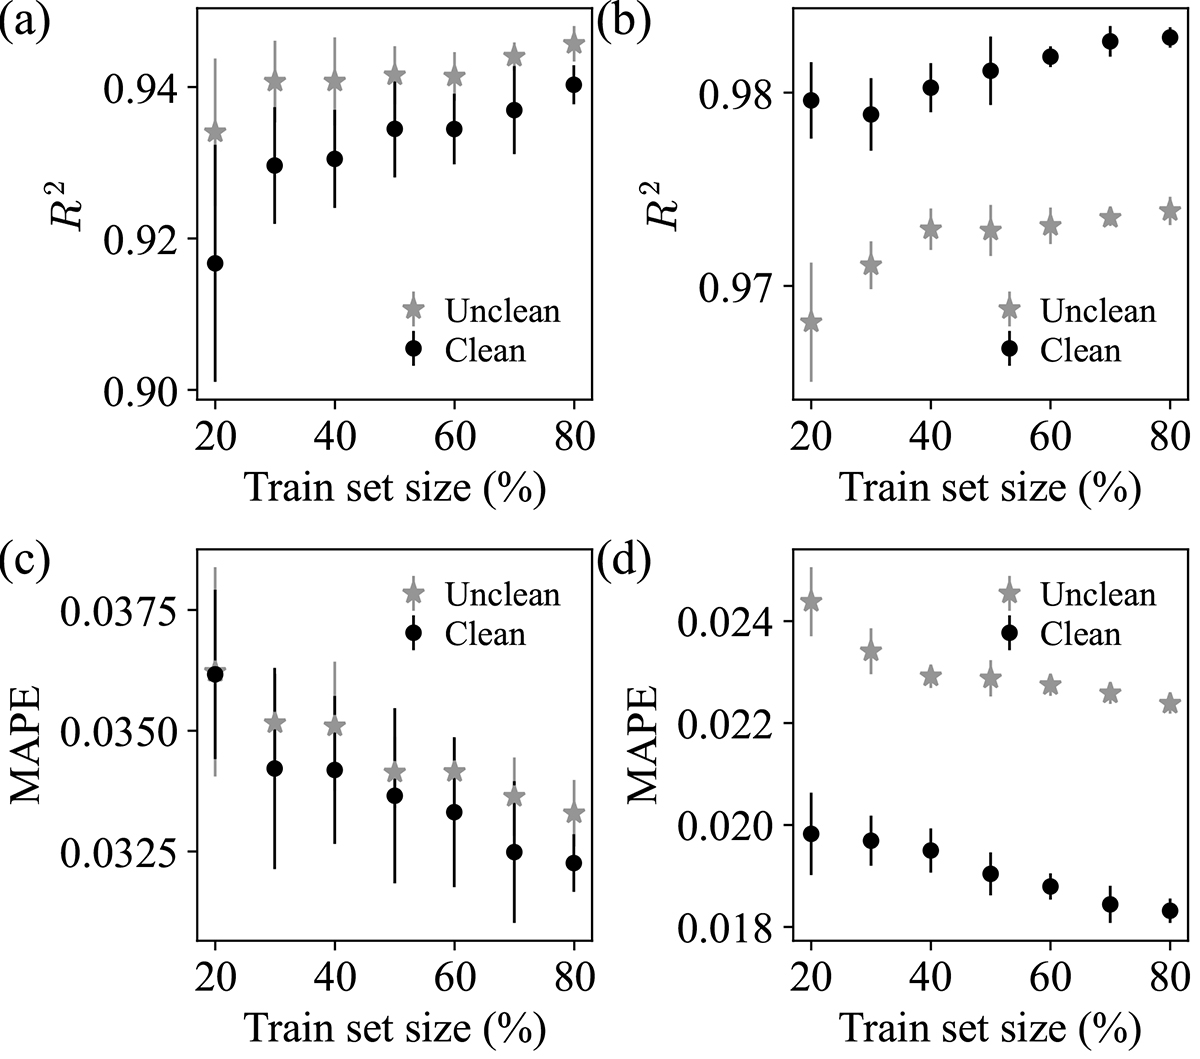
Effect of train set size on the ET models’ predictive performance: Coefficient of determination R2 and MAPE as a function of the percentage of training instances used to train the models for both the clean and unclean samples. a) and c) correspond to the predictions of fluxes at 24 μm, while b) and d) to those at 8 μm. The symbols and error bars represent the mean and standard deviation of the ten-fold cross-validated metrics obtained for ten independent random samplings.
Current usage metrics show cumulative count of Article Views (full-text article views including HTML views, PDF and ePub downloads, according to the available data) and Abstracts Views on Vision4Press platform.
Data correspond to usage on the plateform after 2015. The current usage metrics is available 48-96 hours after online publication and is updated daily on week days.
Initial download of the metrics may take a while.