Fig. 5.
Download original image
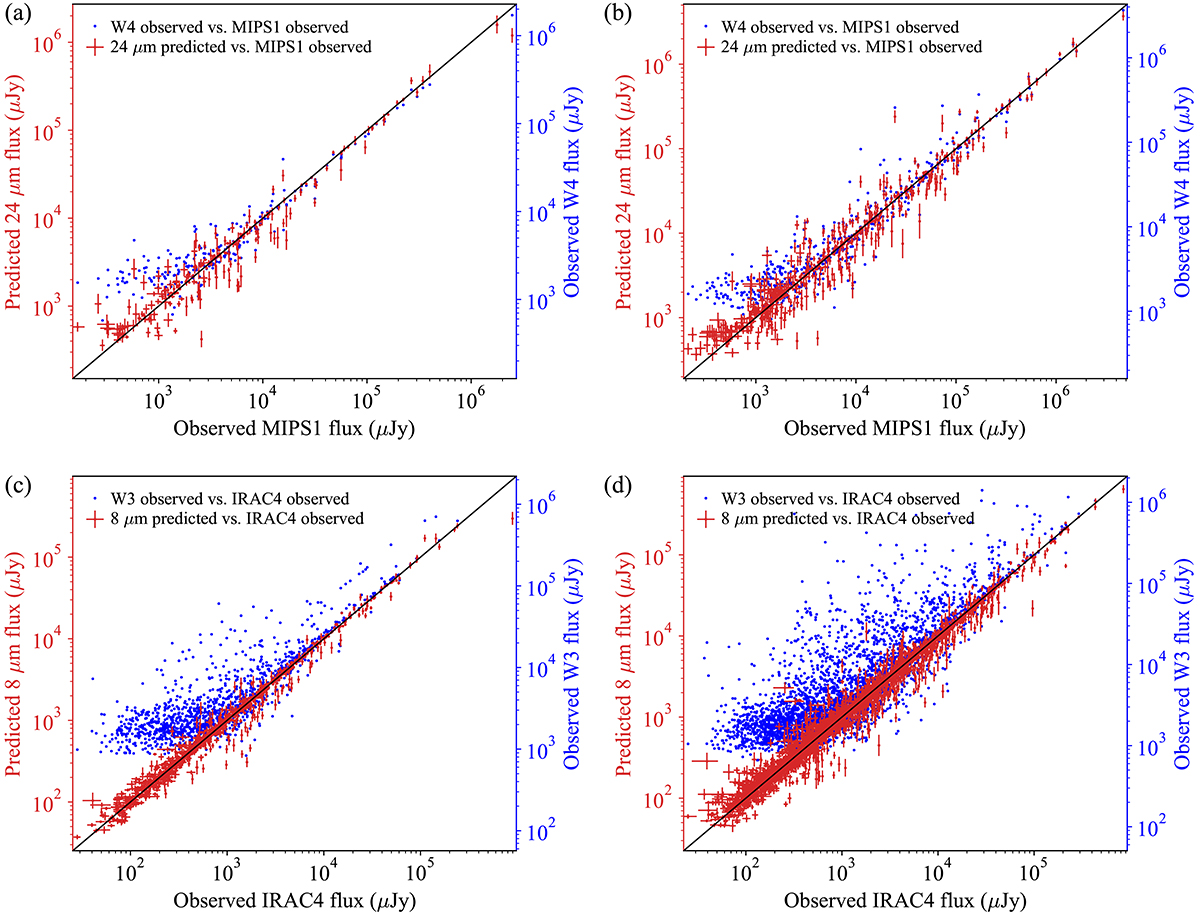
Predicted mid-infrared fluxes (red points, left axes) and observed WISE fluxes (blue points, right axes) vs. observed Spitzer fluxes. All panels display the fluxes for the stars in the corresponding test set. (a) and (b) display the values of MIPS1 (24 μm) and W4 fluxes, while (c) and (d) the values of IRAC4 (8 μm) and W3 fluxes. (a) and (c) show the fluxes of the clean test sets, while (b) and (d) do the same for the unclean test sets. The error bars for the observed WISE data (blue points) have not been included to avoid clogging the plot. Diagonal black lines have been included in all plots to serve as reference and facilitate the comparison. Notice that the limits of both Y axes in each plot, predicted (left) and observed (right), are dissimilar, as they represent fluxes at different wavelengths. In fact, they differ in scale factors of (24/22)2 (for a and b) and (12/8)2 (for c and d), precisely the ratio of fluxes at different wavelengths expected for a black body model. The limits in both axes are chosen so that both clouds of points (blue and red) fall in the diagonal in case both satellites provided perfectly accurate measurements.
Current usage metrics show cumulative count of Article Views (full-text article views including HTML views, PDF and ePub downloads, according to the available data) and Abstracts Views on Vision4Press platform.
Data correspond to usage on the plateform after 2015. The current usage metrics is available 48-96 hours after online publication and is updated daily on week days.
Initial download of the metrics may take a while.