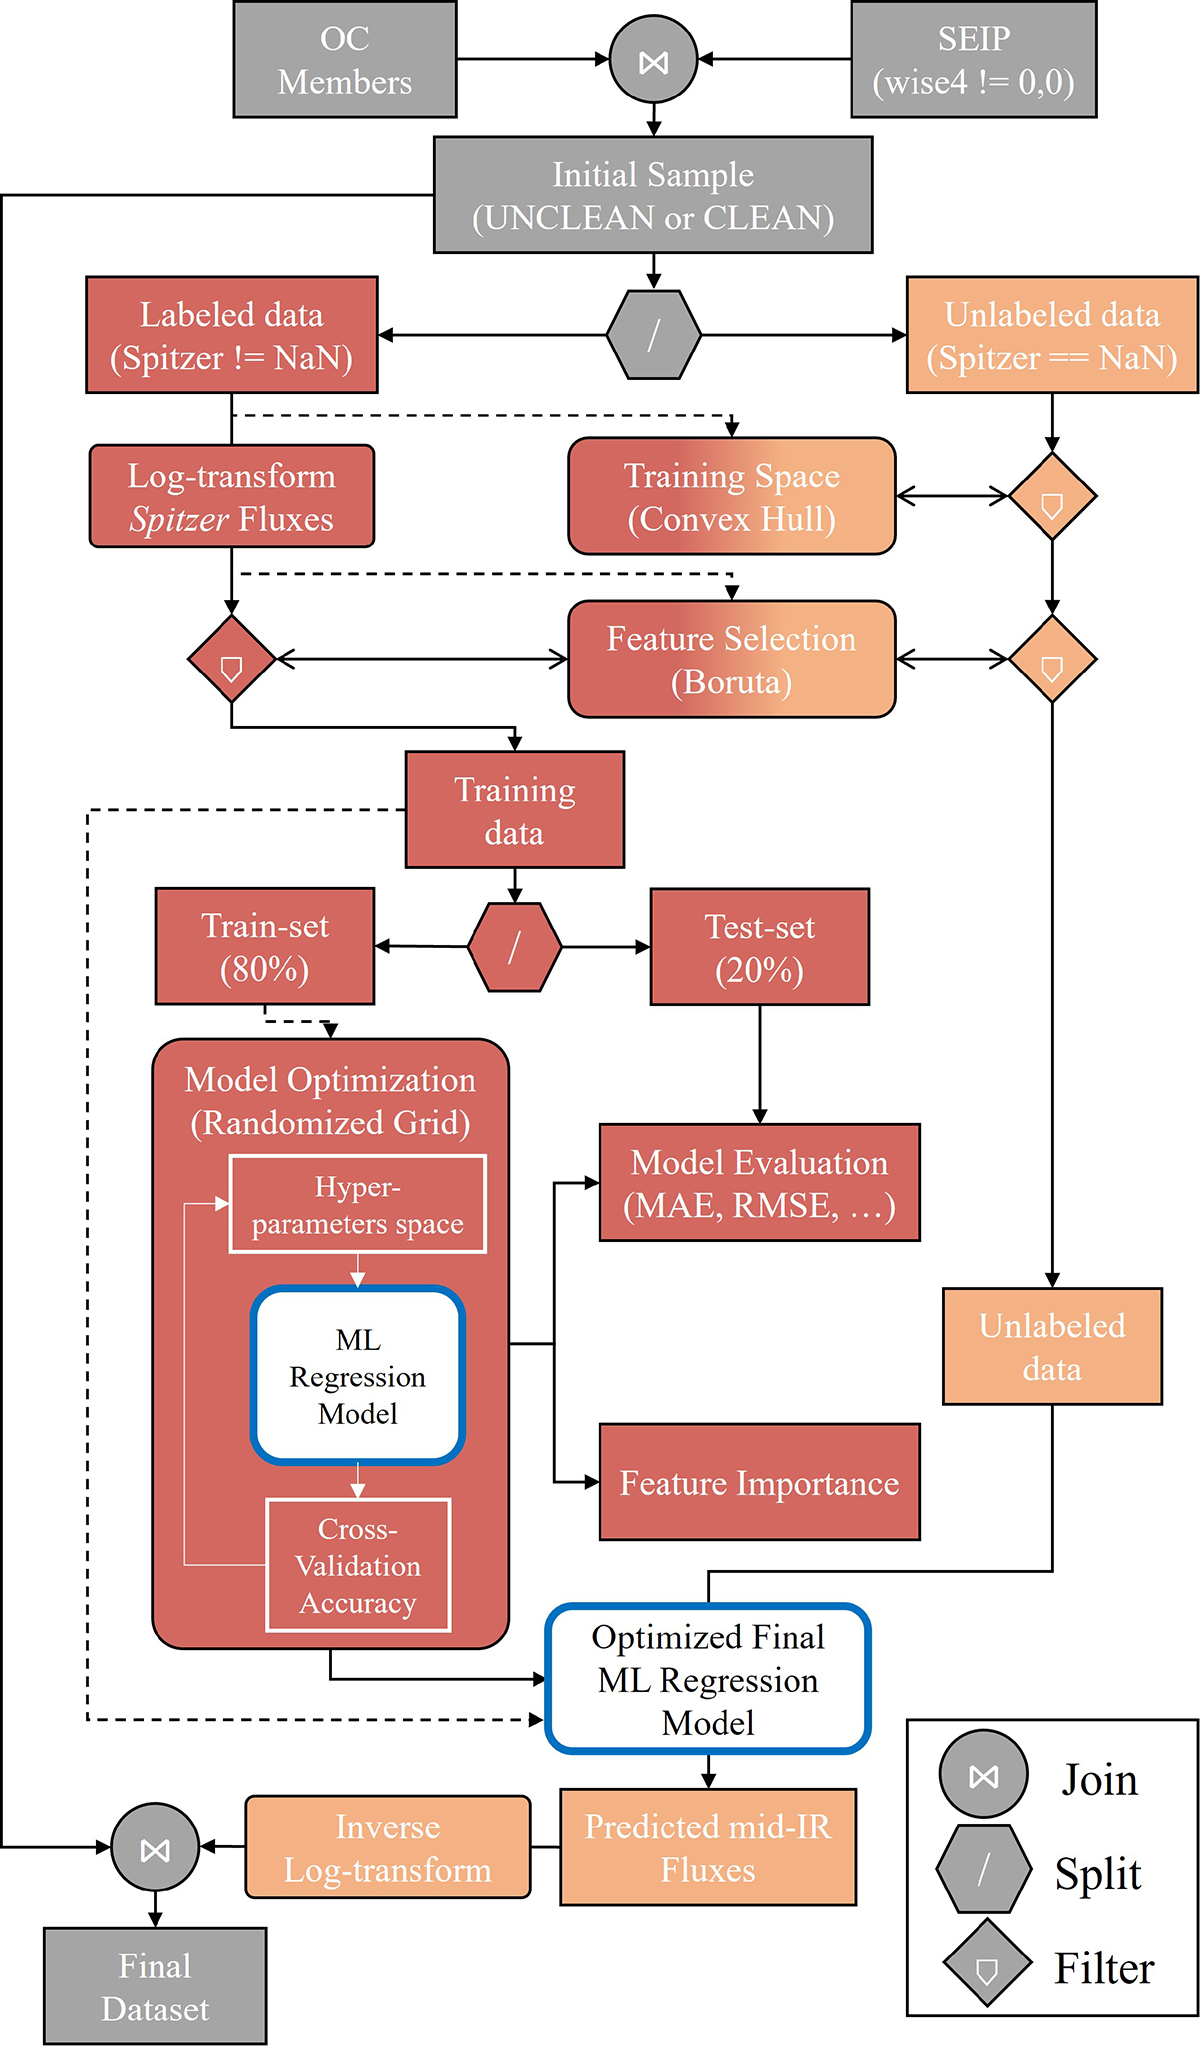
Fig. 3.
Download original image
Workflow detailing the data management and preprocessing steps, as well as the ML model optimization, training, and evaluation procedures, to predict mid-infrared fluxes from WISE variables. Squared boxes represent datasets, while the ML models, algorithms, and other mathematical operations are indicated with rounded boxes. The actual ML regression model (rounded boxes outline in blue) are displayed in more detail in Fig. 4. A dashed arrow-connector between a dataset and an algorithm signifies that the former has been used to train the latter. A double-headed arrow connecting a filter hub and an algorithm signifies “read filtering conditions for rows or columns and apply to dataset arriving to the hub”.
Current usage metrics show cumulative count of Article Views (full-text article views including HTML views, PDF and ePub downloads, according to the available data) and Abstracts Views on Vision4Press platform.
Data correspond to usage on the plateform after 2015. The current usage metrics is available 48-96 hours after online publication and is updated daily on week days.
Initial download of the metrics may take a while.