Fig. A.1.
Download original image
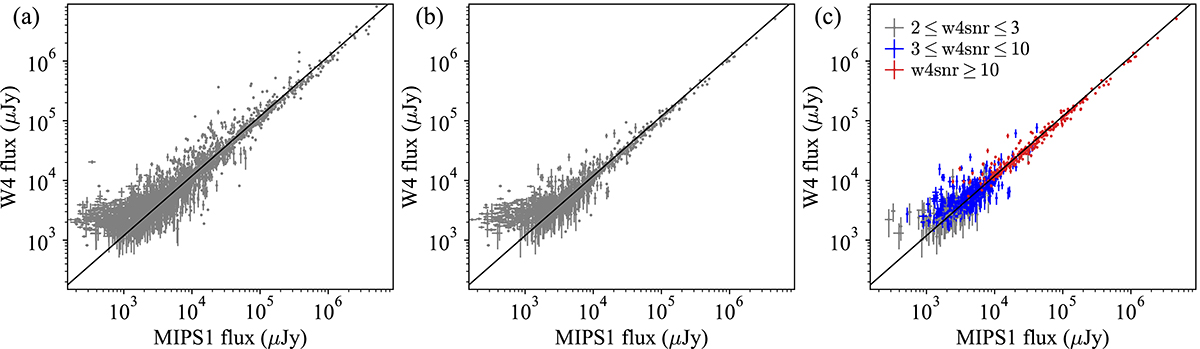
Plots showing the three steps of the data selection procedure according to WISE quality criteria: a) W4 vs. MIPS1 unclean fluxes, b) W4 vs. MIPS1 clean fluxes, and c) W4 vs. MIPS1 fluxes with a S/N above 2 in the former. The different colors in c) correspond to three different S/N interval selections. Each flux is represented with its error bars. Diagonal black lines have been included in order to serve as reference. As in Figure 5, these lines are vertically shifted to take into account that both bands are measured at slightly different wavelengths.
Current usage metrics show cumulative count of Article Views (full-text article views including HTML views, PDF and ePub downloads, according to the available data) and Abstracts Views on Vision4Press platform.
Data correspond to usage on the plateform after 2015. The current usage metrics is available 48-96 hours after online publication and is updated daily on week days.
Initial download of the metrics may take a while.