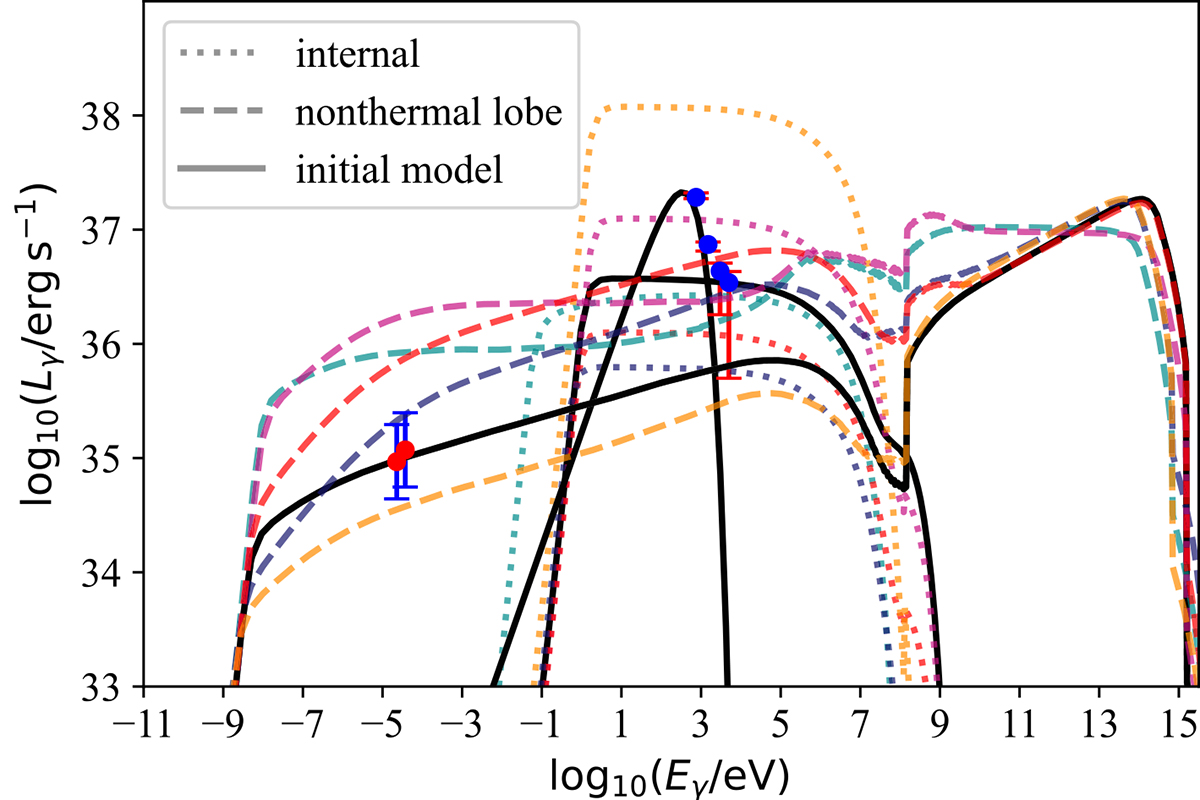
Fig. 7.
Download original image
Exploration of the space parameter of the model. We plot SEDs for sets of input parameters different from those of Table 3 and Fig. 6. The dotted lines correspond to the SEDs of the different specific scenarios for the recollimation shock at the base (b) of the jet, (Sb1 − Sb5). The dashed lines correspond to the SEDs of the scenarios of the reverse shock at the lobes (l) of the jet, (Sl1 − Sl5). The corresponding colors for both shocks are cyan, blue, pink, red, and orange for models 1–5, respectively. The different model parameterizations are described in Sect. 5.4. Solid black lines represent our initial scenario. The observational data are plotted in the same way as in Fig. 6.
Current usage metrics show cumulative count of Article Views (full-text article views including HTML views, PDF and ePub downloads, according to the available data) and Abstracts Views on Vision4Press platform.
Data correspond to usage on the plateform after 2015. The current usage metrics is available 48-96 hours after online publication and is updated daily on week days.
Initial download of the metrics may take a while.