Fig. 6.
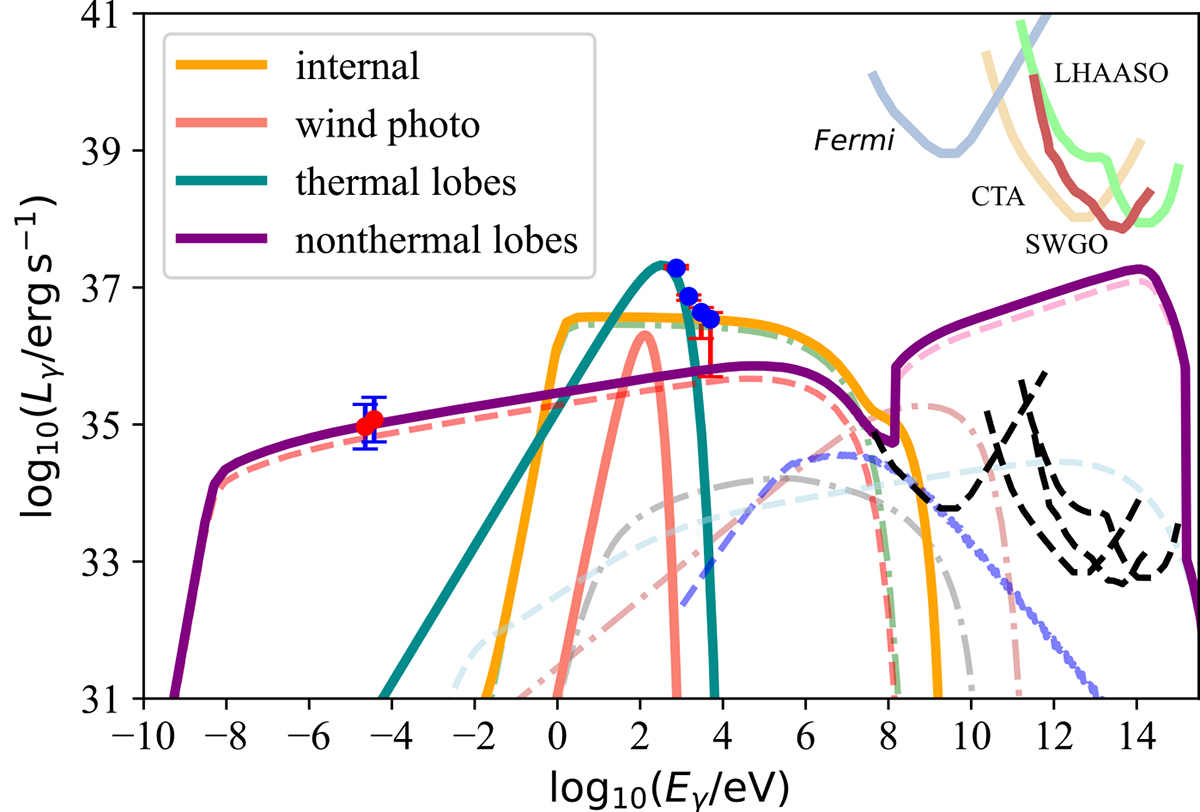
Download original image
Luminosity of S26 as a function of the energy for our physical model with the parameters listed in Table 3. We plot the thermal and nonthermal SEDs of the system. The thermal contributions are the photosphere of the disk-driven wind and the optically thin emission in the lobes. Nonthermal emission is produced in the internal shocks at the base of the jet (orange solid line, jet + counterjet) and in the reverse shock of the lobes (purple solid line, both lobes). Individual nonthermal processes are shown with dashed and dotted-dashed lines (for details see Fig. 5). We plot radio data from ATCA (red dots, Soria et al. 2010) corresponding to the emission of the two lobes combined, and X-ray data from XMM-Newton (blue dots, this work) corresponding to the core and lobes, for obsID 0748390901. Sensitivities of the Fermi, CTA, SWGO and LHAASO gamma-ray detectors are also shown for two different distances: that from S26 (3.9 Mpc, solid colored lines), and a galactic distance of ∼10 kpc (black dashed lines).
Current usage metrics show cumulative count of Article Views (full-text article views including HTML views, PDF and ePub downloads, according to the available data) and Abstracts Views on Vision4Press platform.
Data correspond to usage on the plateform after 2015. The current usage metrics is available 48-96 hours after online publication and is updated daily on week days.
Initial download of the metrics may take a while.