Fig. 7
Download original image
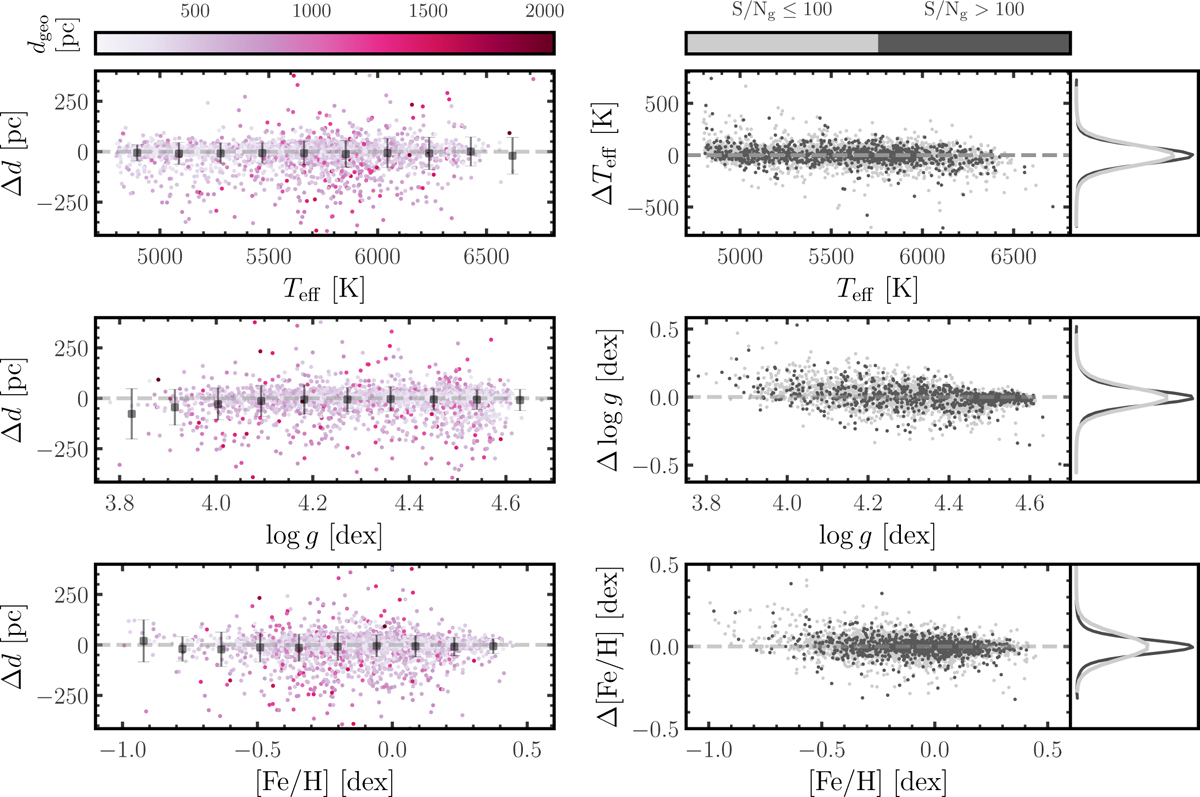
Fractional distance errors and residuals of CNN predictions compared to labeled values from ASPCAP parameters, shown as a function of stellar properties. The residuals are calculated as the predicted values minus the labeled ones. The left three panels show the fractional distance error vs. three ASPCAP stellar parameters, color-coded by geometric distance. The gray dots with error bars represent the mean and standard deviation of the error in each bin. The right three panels show the residuals of Teff, log ɡ, and [Fe/H] vs. the ASPCAP values, color-coded by S/Ng (gray for spectra with S/Ng ≤ 100 and black for spectra with S/Ng > 100). The projected residual distributions are shown on the right.
Current usage metrics show cumulative count of Article Views (full-text article views including HTML views, PDF and ePub downloads, according to the available data) and Abstracts Views on Vision4Press platform.
Data correspond to usage on the plateform after 2015. The current usage metrics is available 48-96 hours after online publication and is updated daily on week days.
Initial download of the metrics may take a while.