Fig. 2
Download original image
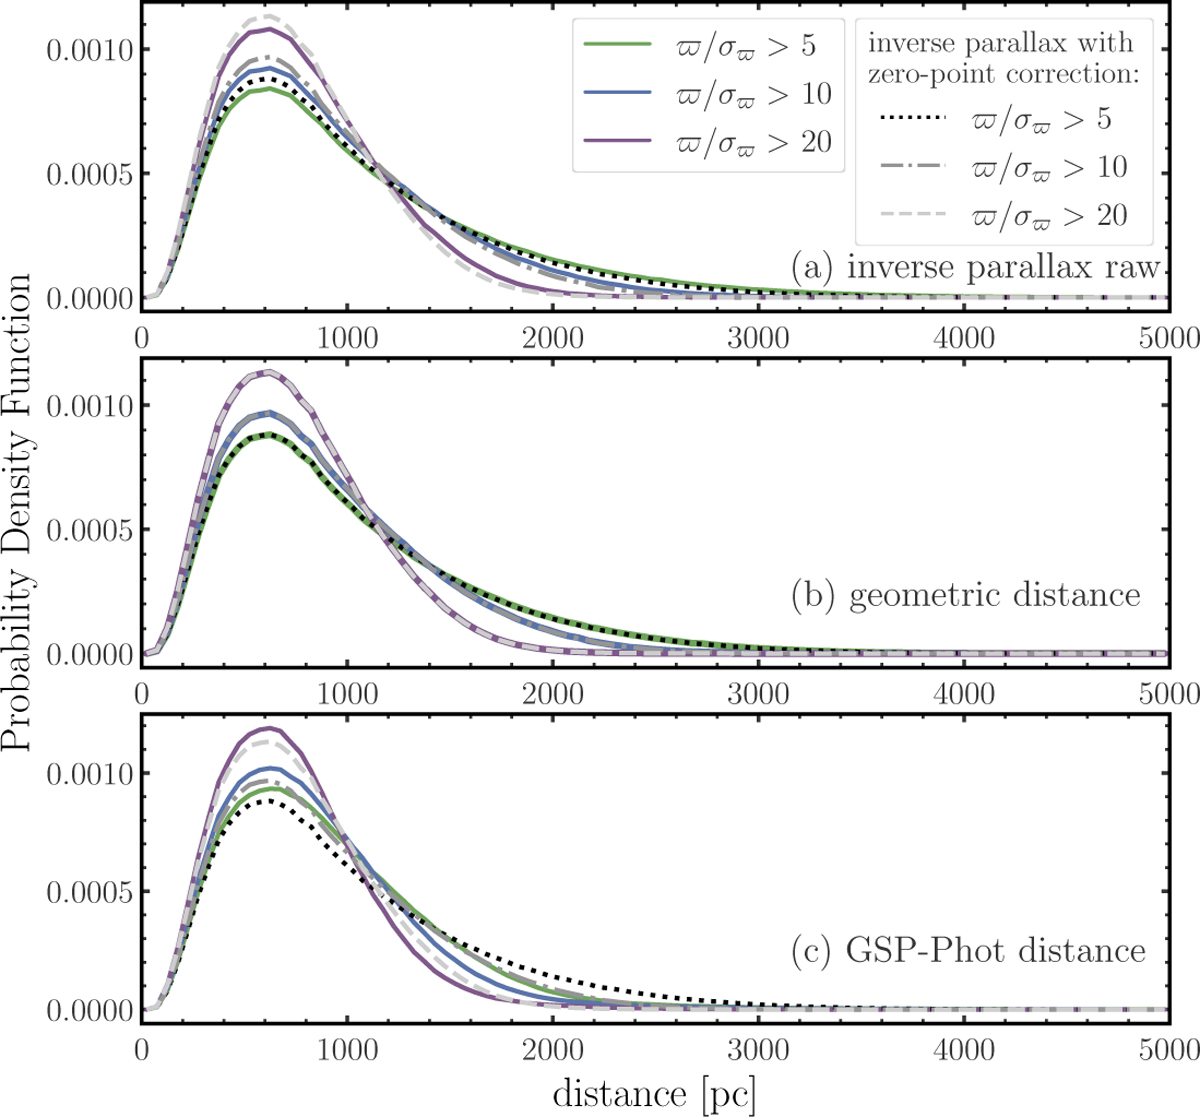
Distributions of distances from different sources in the solar-like star dataset. The green, blue, and purple lines represent the distributions with ϖ/σϖ > 5, ϖ/σϖ > 10, and ϖ/σϖ > 20, respectively. Panels a, b, and c show the distributions of raw inverse parallax, geometric distances, and GSP-Phot distances. The distributions of inverse parallax with zero-point correction for different error cuts are shown as black dotted, gray dot-dashed, and silver dashed lines, respectively. For comparison, these distributions are shown in all three panels.
Current usage metrics show cumulative count of Article Views (full-text article views including HTML views, PDF and ePub downloads, according to the available data) and Abstracts Views on Vision4Press platform.
Data correspond to usage on the plateform after 2015. The current usage metrics is available 48-96 hours after online publication and is updated daily on week days.
Initial download of the metrics may take a while.