Fig. 11
Download original image
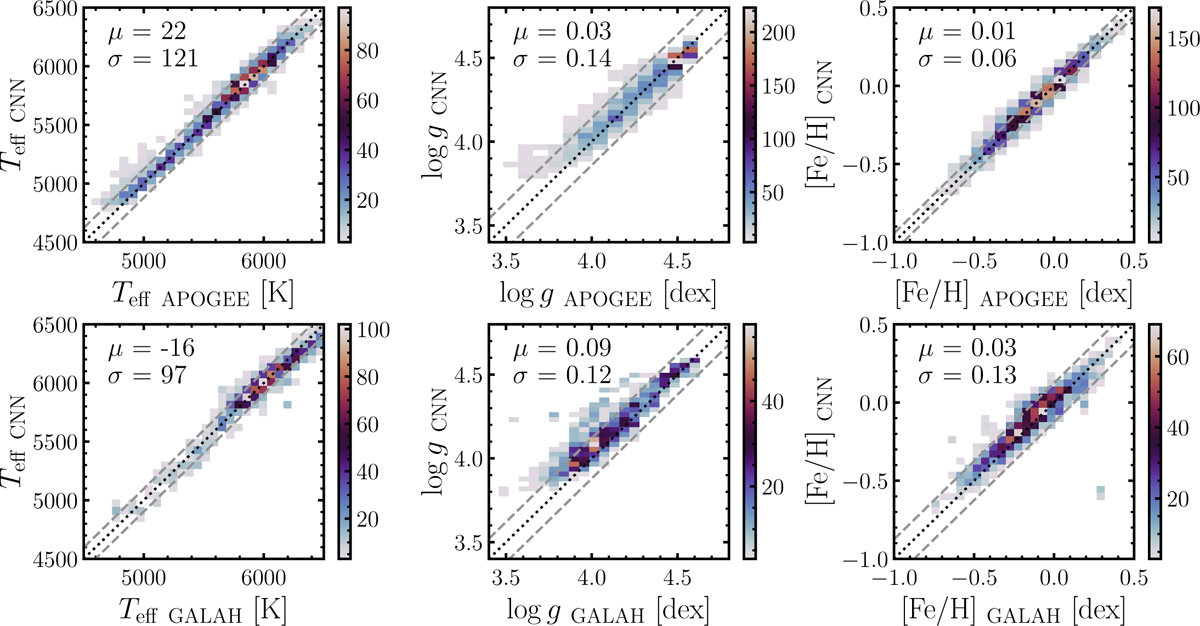
Comparison of the stellar parameters from this work with those from the APOGEE and GALAH surveys. Each column corresponds to a specific parameter: Teff, log 𝑔, or [Fe/H]. The top panels represent the comparison between this work and APOGEE DR17 for 2677 common stars, while the bottom panels show the results with GALAH DR3 for 2218 stars, both color-coded by number density. The bias µ (calculated as CNN-label minus survey-label) and scatter σ, as well as the black dotted line and gray dashed line, are the same as described in Fig. 10.
Current usage metrics show cumulative count of Article Views (full-text article views including HTML views, PDF and ePub downloads, according to the available data) and Abstracts Views on Vision4Press platform.
Data correspond to usage on the plateform after 2015. The current usage metrics is available 48-96 hours after online publication and is updated daily on week days.
Initial download of the metrics may take a while.