Fig. 10
Download original image
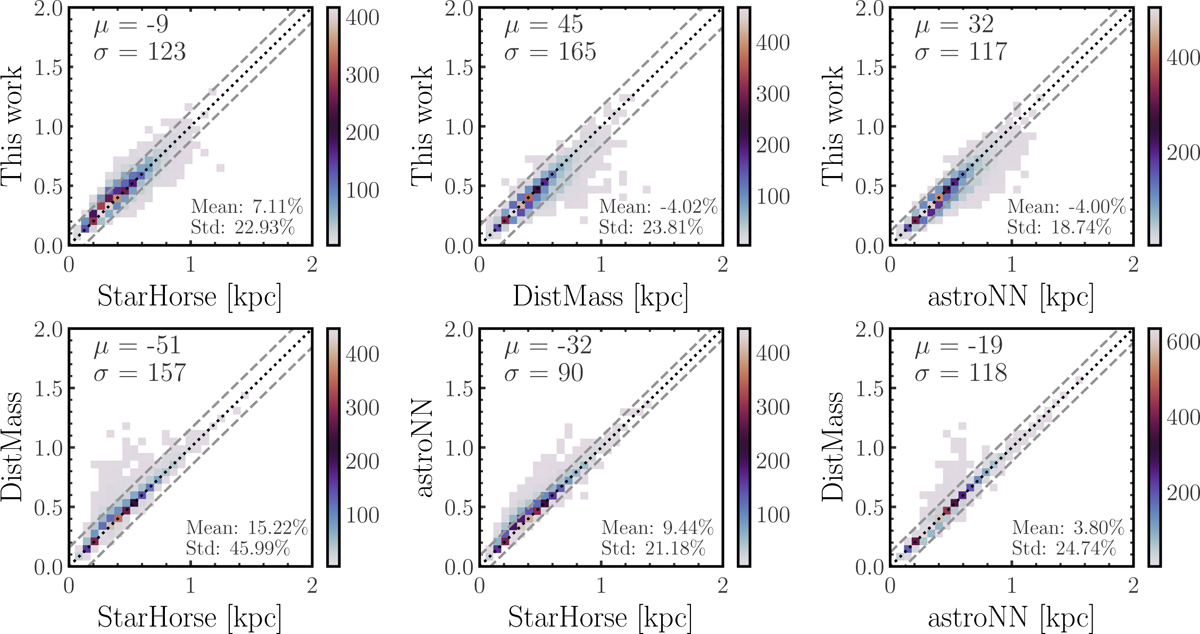
Comparison of estimated distances between this work, StarHorse (Queiroz et al. 2018, 2020), DistMass (Stone-Martinez et al. 2024), and astroNN (Leung & Bovy 2019b). The top panels show the comparison of 5443, 5240, and 5648 stars in common with StarHorse, DistMass, and astroNN, respectively. The bottom panels show the pairwise comparison between StarHorse, DistMass, and astroNN, with 4401, 4788, and 5242 stars in common, respectively (in the order shown in the figure). The bias µ (calculated as x-label minus y-label) and scatter σ (in units of pc) are indicated in each panel, as well as the corresponding mean and standard deviation of the fractional error. The black dotted lines represent the 1:1 line, and the gray dashed lines indicate the 1σ deviation in the difference between the compared labels. The color denotes the number density.
Current usage metrics show cumulative count of Article Views (full-text article views including HTML views, PDF and ePub downloads, according to the available data) and Abstracts Views on Vision4Press platform.
Data correspond to usage on the plateform after 2015. The current usage metrics is available 48-96 hours after online publication and is updated daily on week days.
Initial download of the metrics may take a while.