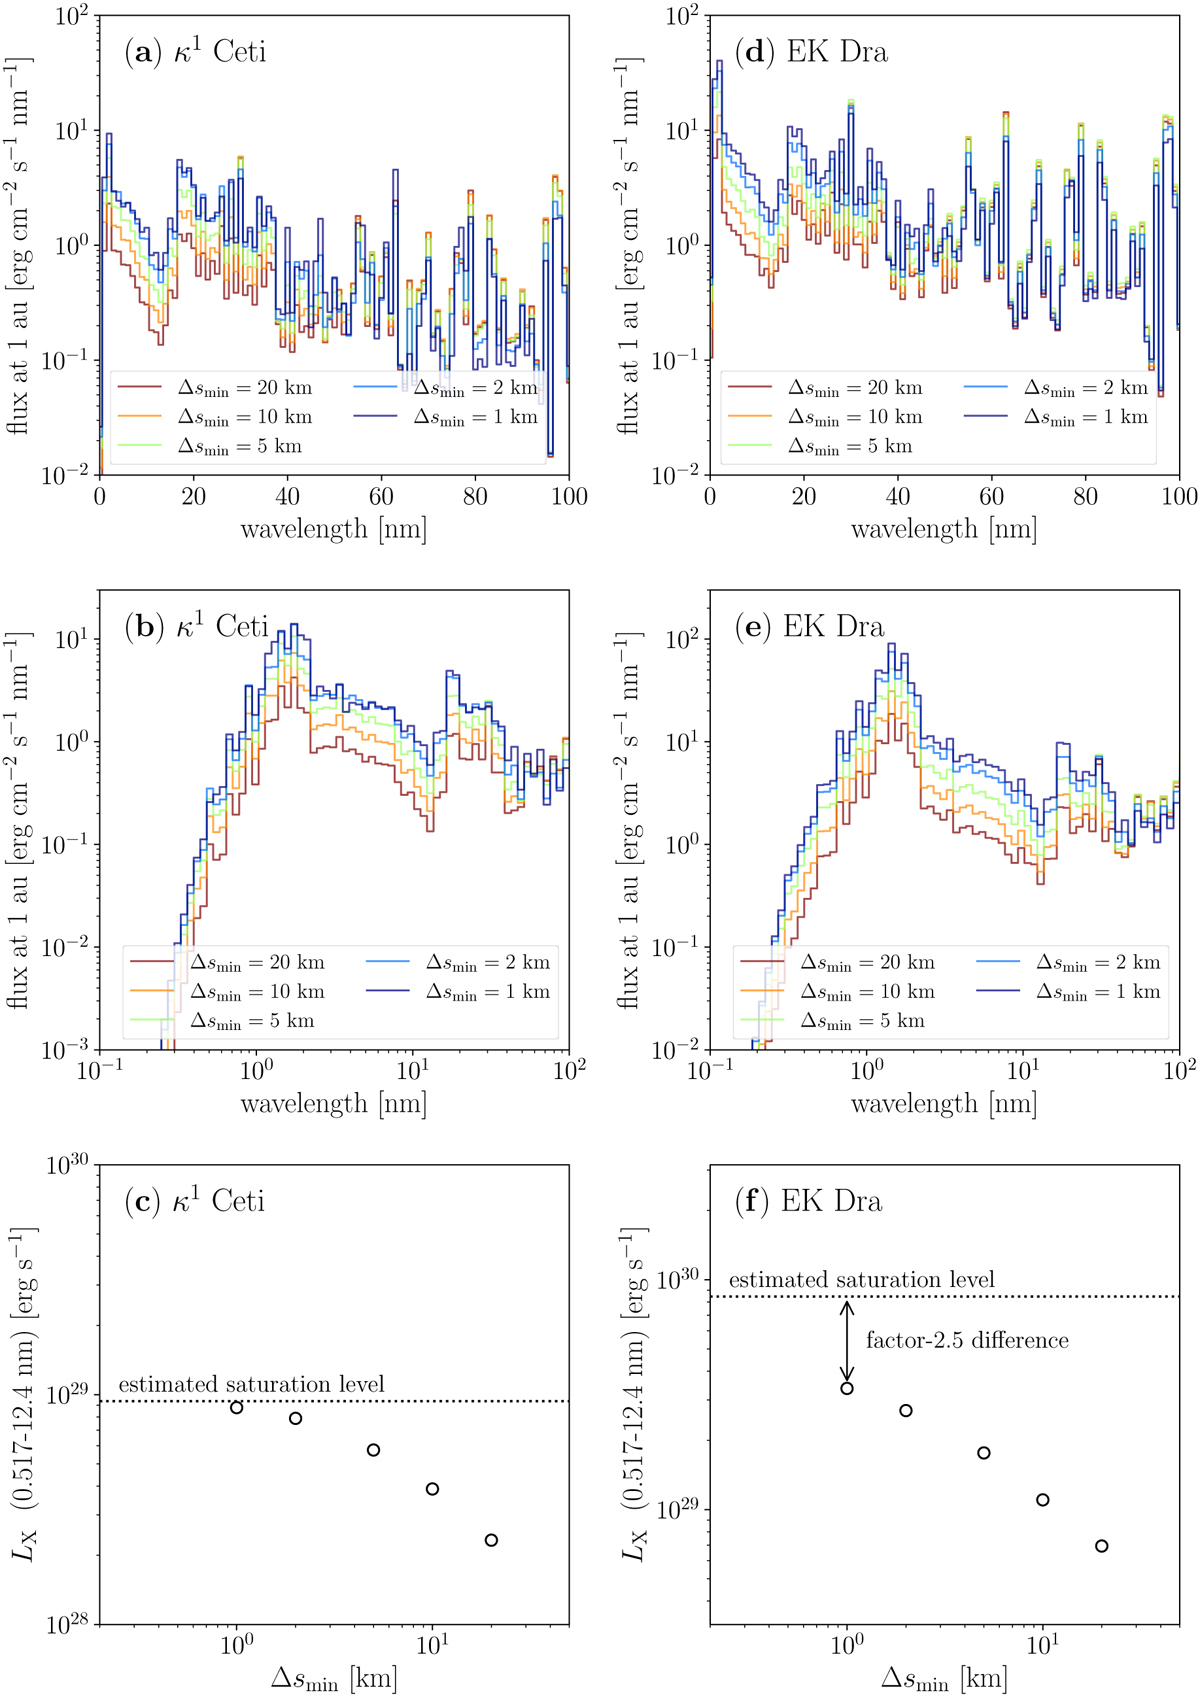
Fig. 9
Download original image
Effect of transition region resolution (∆smin) on the XUV spectra of κ1 Ceti (left) and EK Dra (right). The top and middle panels display the bin-averaged XUV spectra for varying resolutions, with different colours indicating different resolutions. The bin size definition follows Fig. 3. The bottom panels illustrate the computed X-ray luminosity as a function of ∆smin . The dotted lines indicate the results obtained using the LTRAC method, where the transition region is artificially broadened. The X-ray luminosity is expected to saturate at this level when computed with adequate resolution.
Current usage metrics show cumulative count of Article Views (full-text article views including HTML views, PDF and ePub downloads, according to the available data) and Abstracts Views on Vision4Press platform.
Data correspond to usage on the plateform after 2015. The current usage metrics is available 48-96 hours after online publication and is updated daily on week days.
Initial download of the metrics may take a while.