Open Access
Fig. 7
Download original image
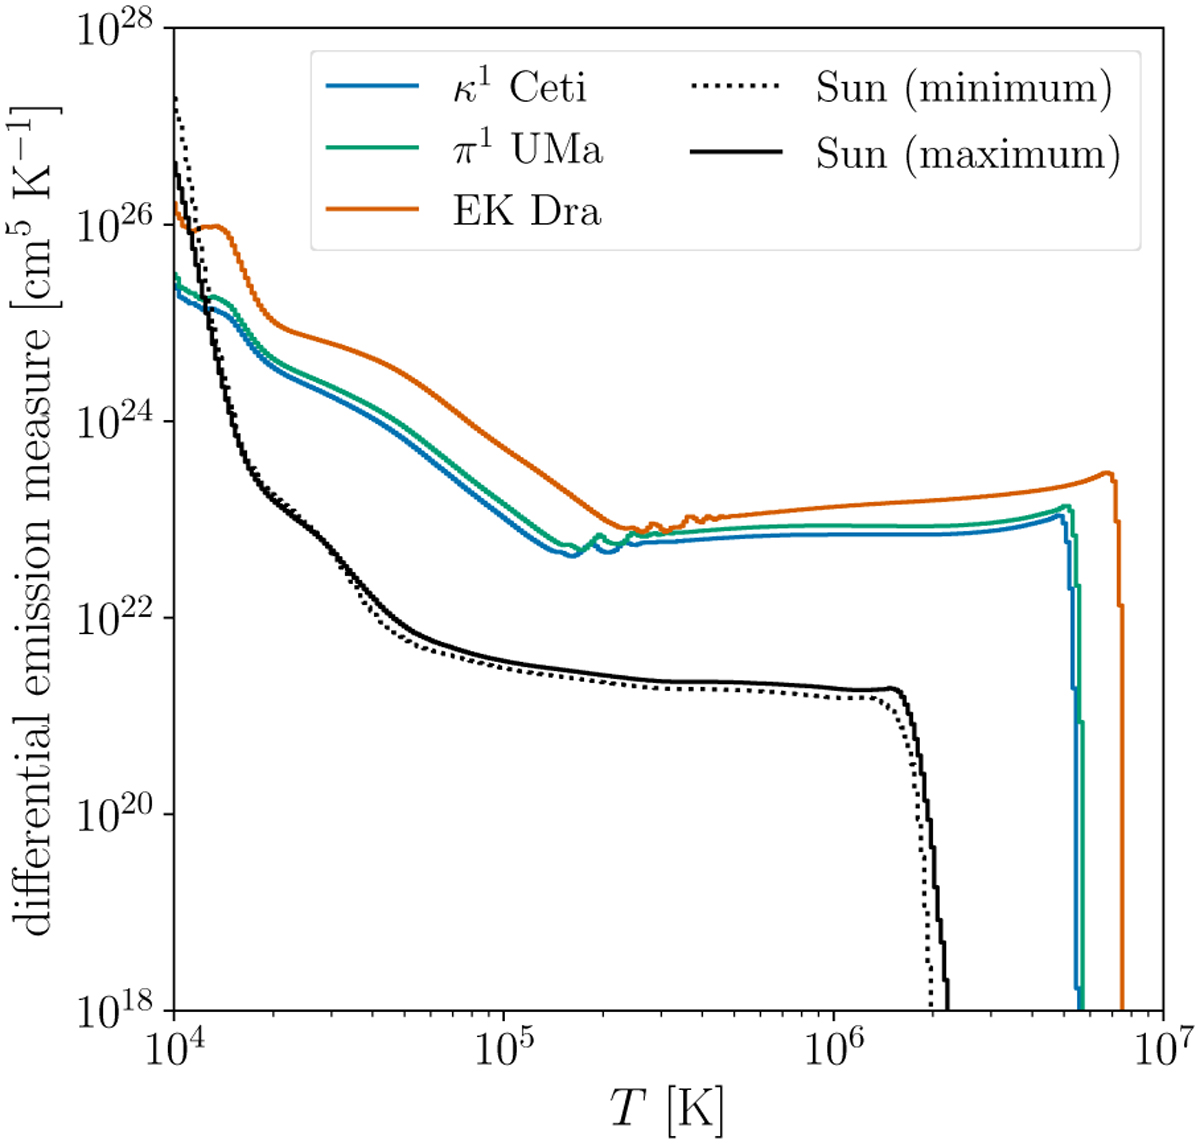
Comparison of the time-averaged DEMs calculated for the Sun, κ1 Ceti, π1 UMa, and EK Dra. The black lines represent the Sun with the solid line for the activity maximum and the dotted line for the activity minimum, while the coloured lines correspond to the other three stars.
Current usage metrics show cumulative count of Article Views (full-text article views including HTML views, PDF and ePub downloads, according to the available data) and Abstracts Views on Vision4Press platform.
Data correspond to usage on the plateform after 2015. The current usage metrics is available 48-96 hours after online publication and is updated daily on week days.
Initial download of the metrics may take a while.