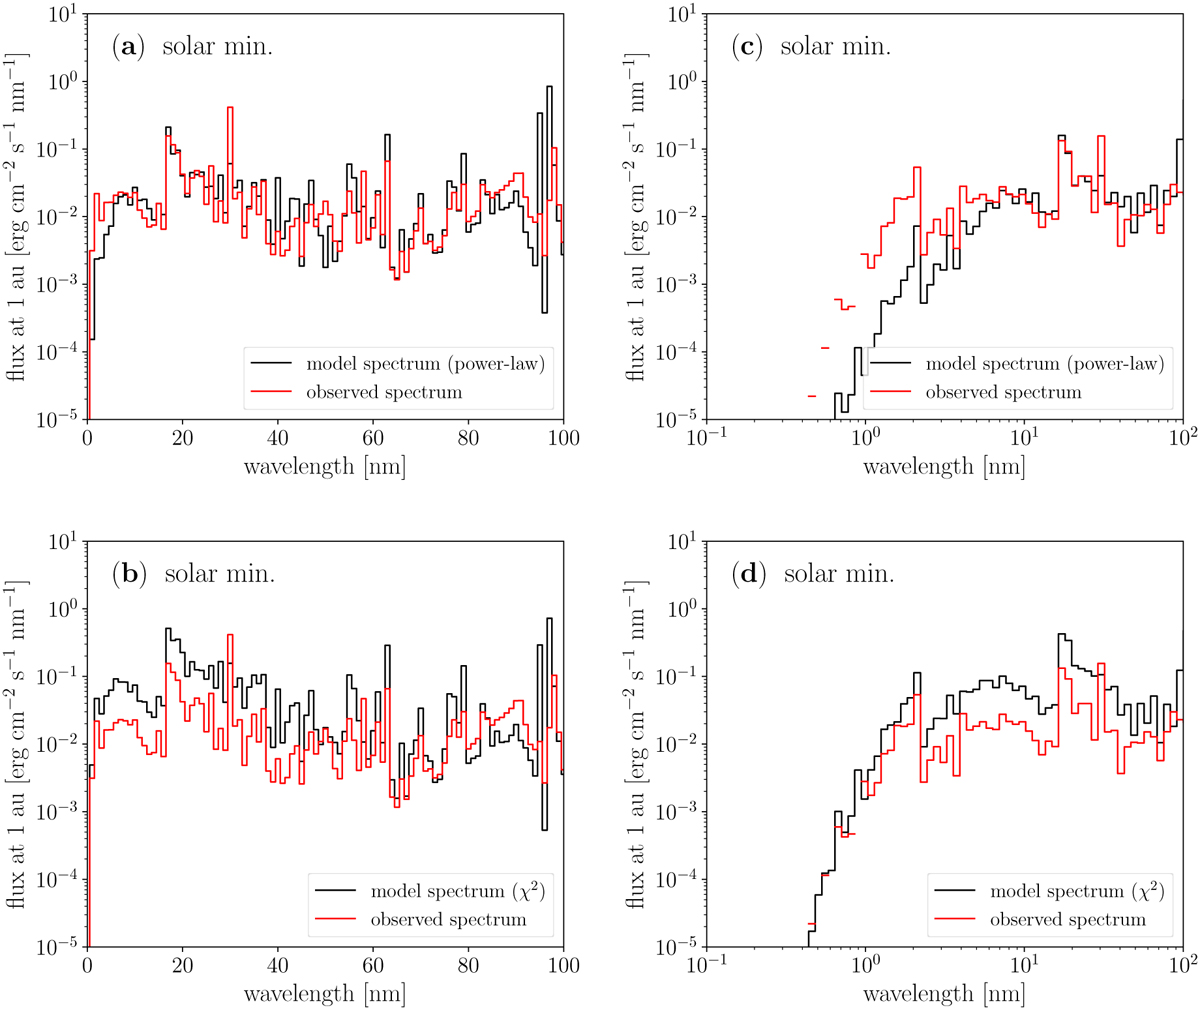
Fig. 4
Download original image
Comparison between the model spectrum obtained by the average over the loop lengths (black) and the observed spectrum (red) for the solar activity minimum. The left side compares the averages in bins equally divided in linear scale, while the right side compares the averages in bins equally divided in logarithmic scale (bin size defined as in Fig. 3). The top panels display the averaged model spectrum weighted by the power-law distribution, and the bottom panels display the averaged model spectrum weighted by the chi-squared distribution.
Current usage metrics show cumulative count of Article Views (full-text article views including HTML views, PDF and ePub downloads, according to the available data) and Abstracts Views on Vision4Press platform.
Data correspond to usage on the plateform after 2015. The current usage metrics is available 48-96 hours after online publication and is updated daily on week days.
Initial download of the metrics may take a while.