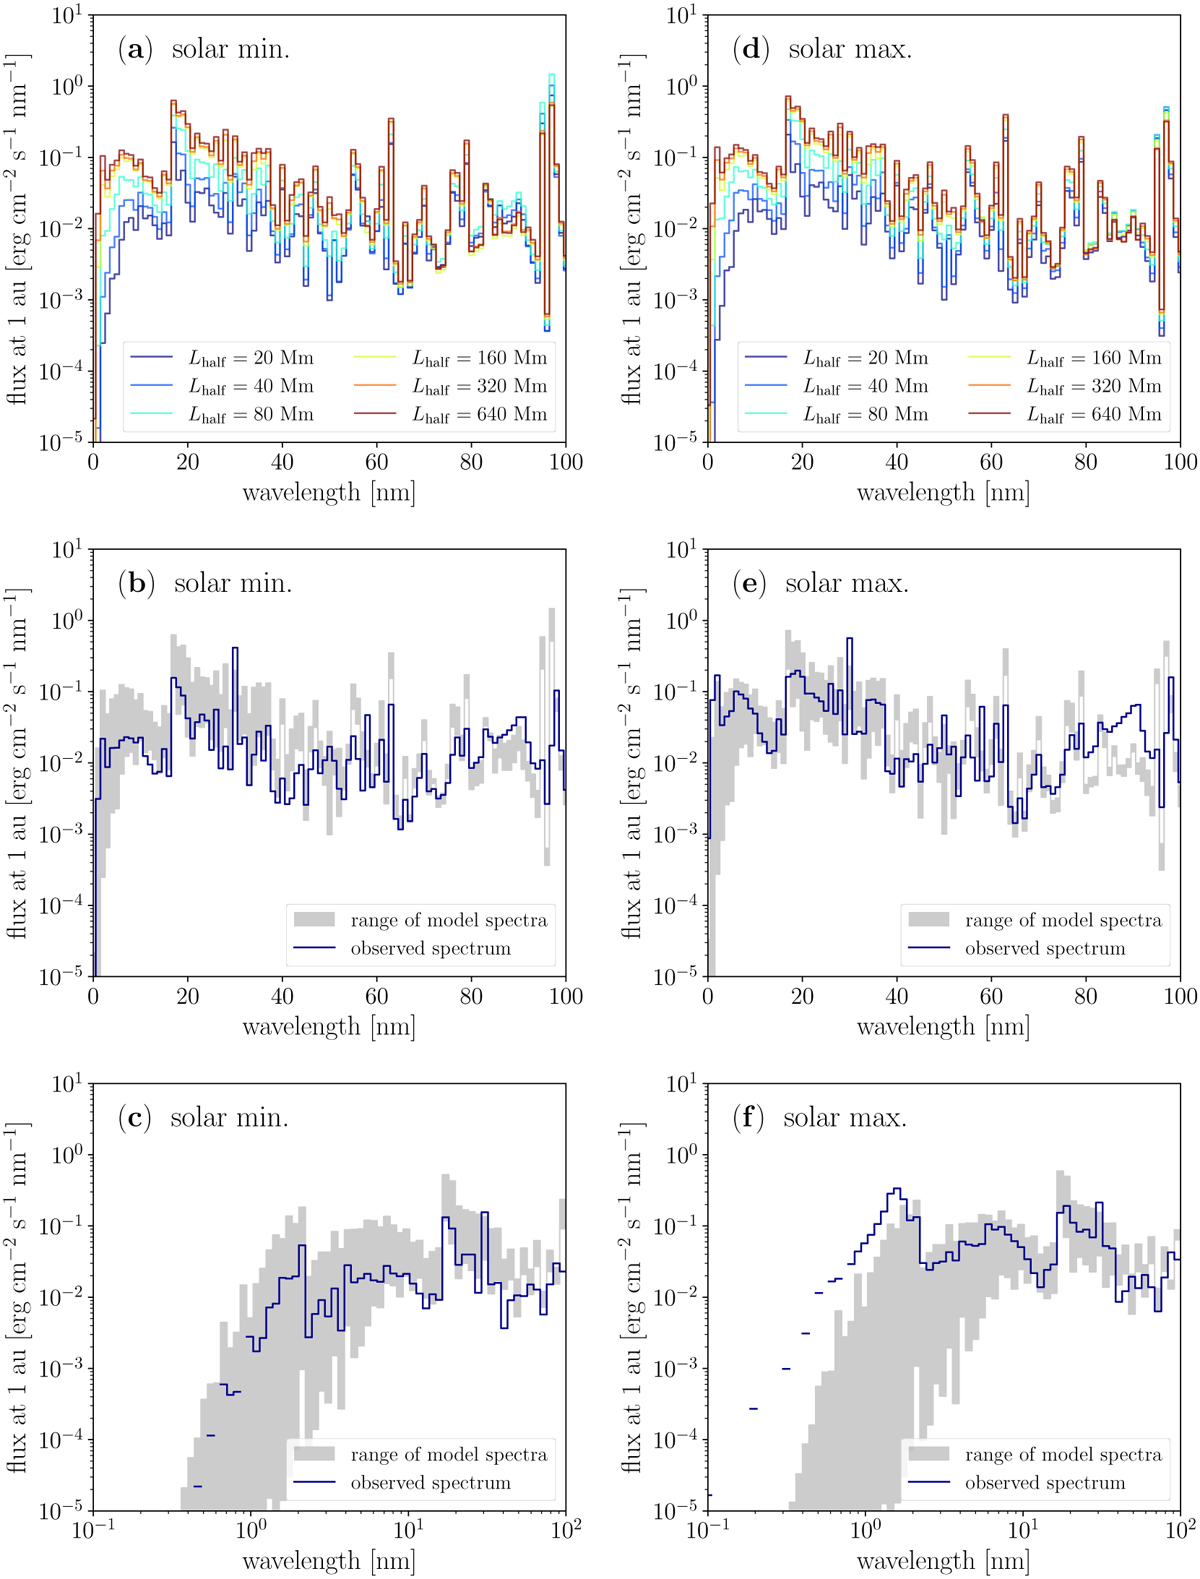
Fig. 3
Download original image
Dependence of the XUV emission spectrum on the loop length and a comparison between model outputs and observations. The left panels (a–c) show data for the solar minimum, while the right panels (d–f) display data for the solar maximum. Top panels (a, d) show the looplength dependence of the XUV spectrum, with different colours representing different loop lengths. For clarity, the spectra are averaged over 1 nm intervals. Middle panels (b, e) show the comparison of the model output range (grey shaded area) and observational data (solid blue line). Similar to the top panels, the spectra are averaged over 1 nm intervals. Bottom panels (c, f) are similar to the middle panels, but the spectra are averaged over bins that are evenly divided on a logarithmic scale (see text for details).
Current usage metrics show cumulative count of Article Views (full-text article views including HTML views, PDF and ePub downloads, according to the available data) and Abstracts Views on Vision4Press platform.
Data correspond to usage on the plateform after 2015. The current usage metrics is available 48-96 hours after online publication and is updated daily on week days.
Initial download of the metrics may take a while.