Open Access
Fig. C.1
Download original image
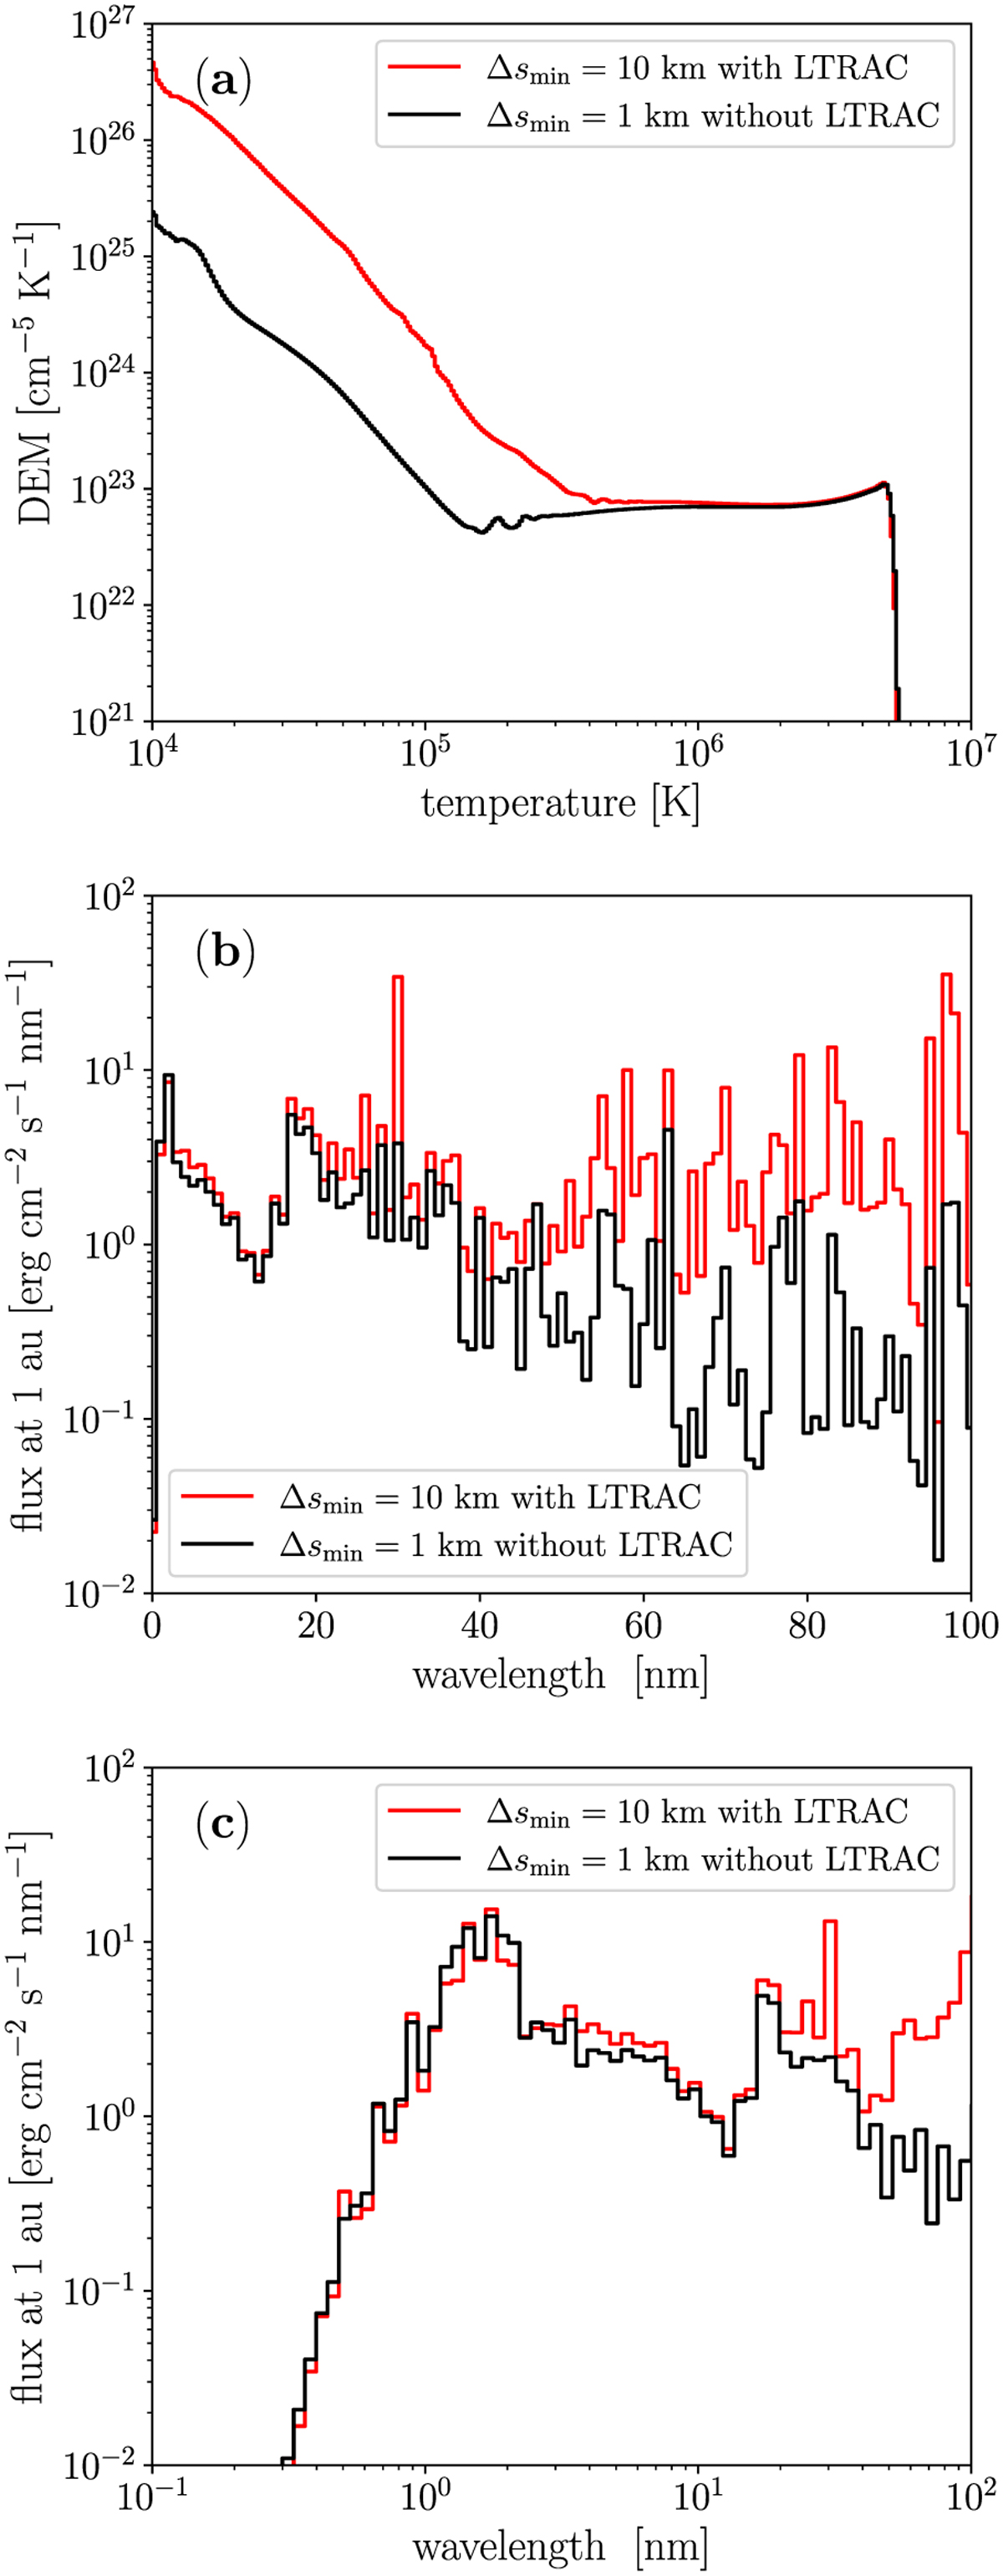
Comparison between the low-resolution simulation using the LTRAC method and the high-resolution simulation without the LTRAC method. Panel (a) shows a comparison of the DEMs, whereas Panels (b) and (c) present a comparison of the bin-averaged spectra. The binning of the spectra is performed in the same way as in Fig. 3.
Current usage metrics show cumulative count of Article Views (full-text article views including HTML views, PDF and ePub downloads, according to the available data) and Abstracts Views on Vision4Press platform.
Data correspond to usage on the plateform after 2015. The current usage metrics is available 48-96 hours after online publication and is updated daily on week days.
Initial download of the metrics may take a while.