Fig. 10
Download original image
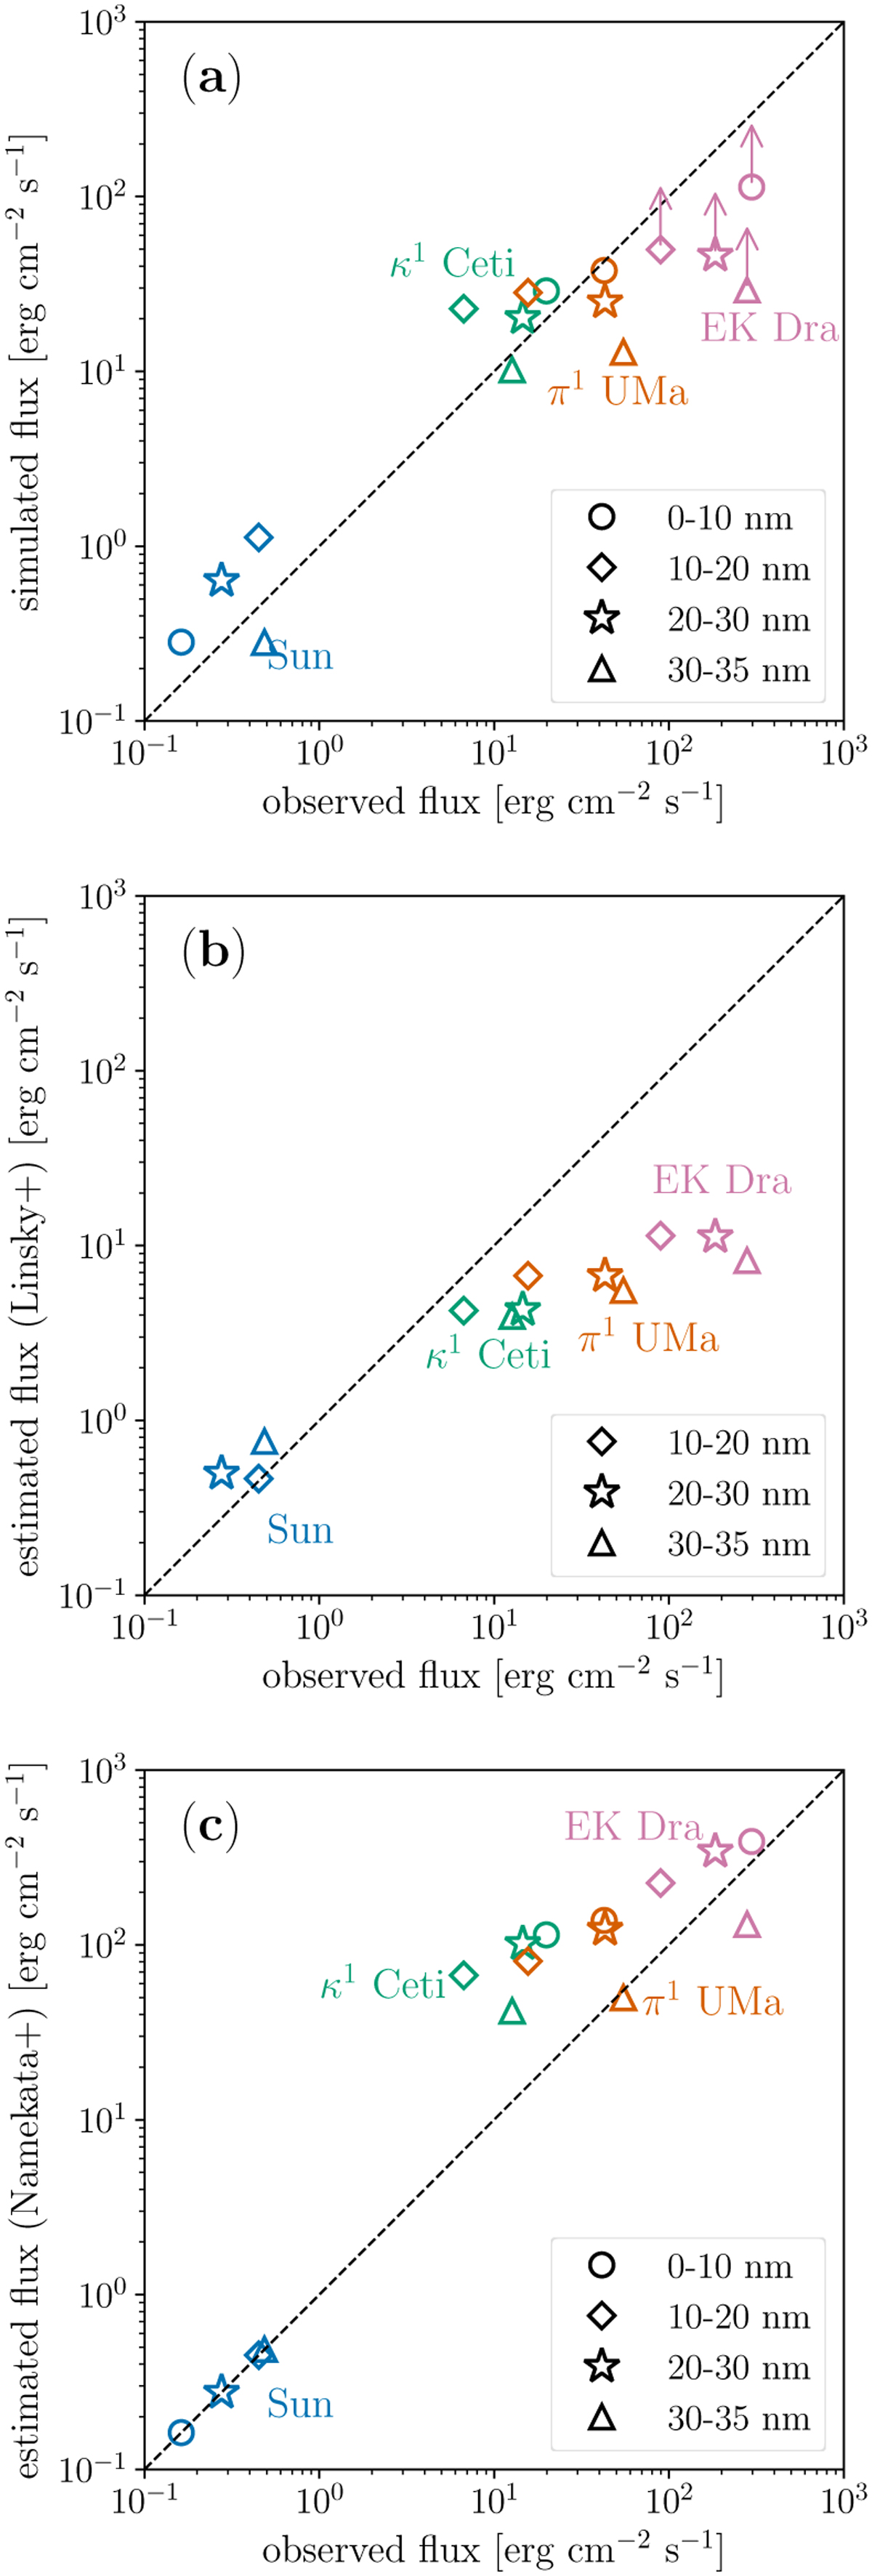
Comparison of various XUV estimation methods and observational data. Following Linsky et al. (2014), we divided the observable wavelength band into four bins and compared the flux in each bin, distinguished by symbols. Symbol colours correspond to different stars. Panel a shows the comparison between our model and the observation. Arrows indicate the correction to the model spectrum due to insufficient resolution. Panel b represents the comparison between the Lyman-alpha-based estimation (Linsky et al. 2014) and observation, while Panel c shows the comparison between the estimation based on surface magnetic flux (Namekata et al. 2023) and observation.
Current usage metrics show cumulative count of Article Views (full-text article views including HTML views, PDF and ePub downloads, according to the available data) and Abstracts Views on Vision4Press platform.
Data correspond to usage on the plateform after 2015. The current usage metrics is available 48-96 hours after online publication and is updated daily on week days.
Initial download of the metrics may take a while.