Fig. 6
Download original image
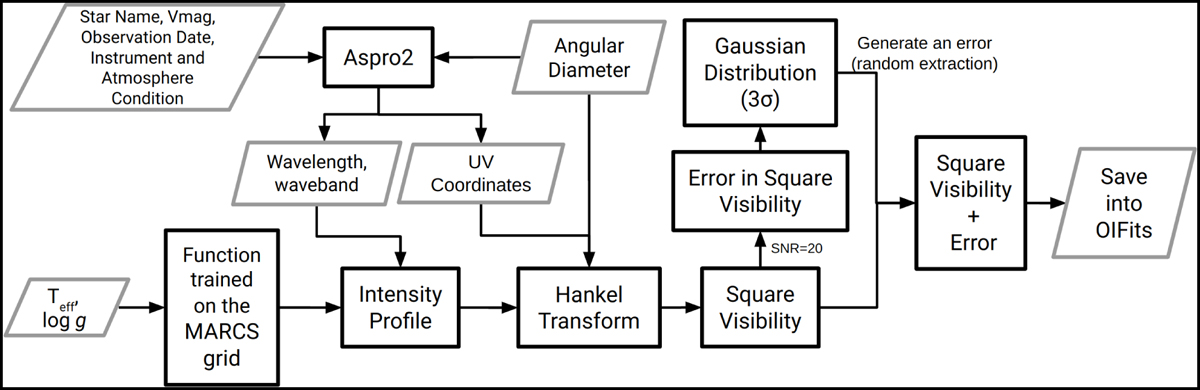
Flow chart giving the steps to simulate the interferometric data mimicking CHARA/SPICA observations. The pipeline carries out a Hankel transform on the intensity profile from the stellar radiation transfer calculations, using the UV coordinates and wavelength from Aspro2. The error is added to the square visibility, taking S/N = 20 and generates an error with a random extraction for each point in the square visibility. Input and output are shown in parallogram (grey) and intermediate processes are shown in rectangle (black).
Current usage metrics show cumulative count of Article Views (full-text article views including HTML views, PDF and ePub downloads, according to the available data) and Abstracts Views on Vision4Press platform.
Data correspond to usage on the plateform after 2015. The current usage metrics is available 48-96 hours after online publication and is updated daily on week days.
Initial download of the metrics may take a while.