Fig. 5
Download original image
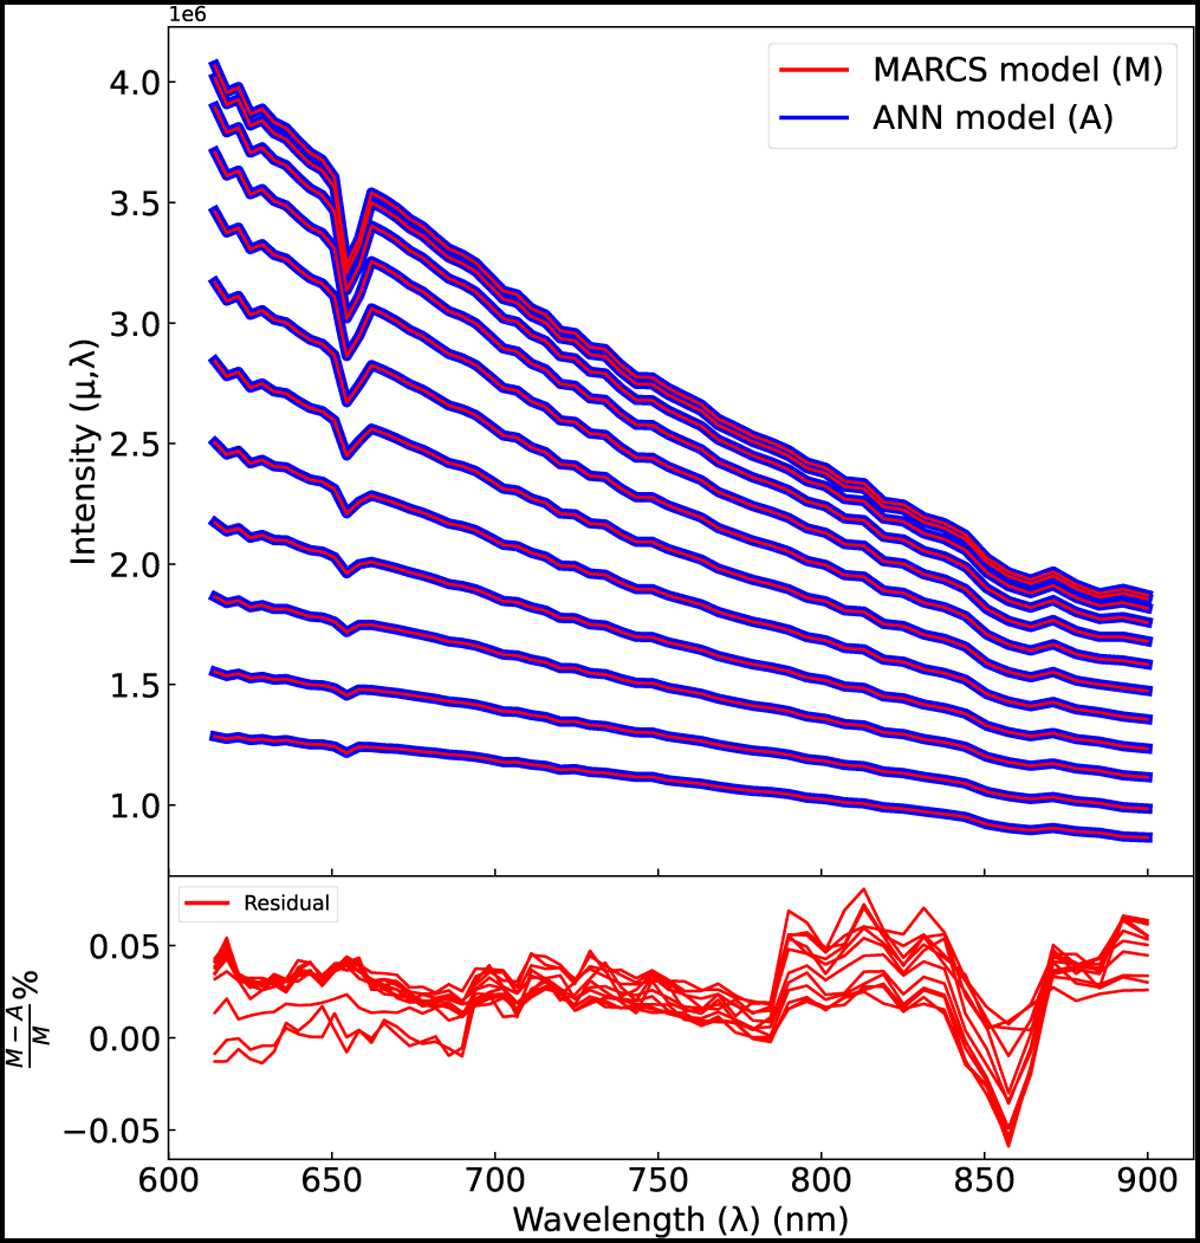
Intensity from the MARCS model (red) as a function of λ for 12 different µ values (Radau sampling) along the radius over-plotted on the reconstructed values from the ANN (blue and thicker) for the same Teff and log g (top). From top to bottom, the figure presents the intensity profiles in ascending order of radius (or descending order of µ). The intensity profile of the model at Teff = 6176 K and log g = 3.82 dex is also given (bottom). This plot represents (in terms of percentage) the residual between the intensity from MARCS and the intensity values from the ANN for the different µ values.
Current usage metrics show cumulative count of Article Views (full-text article views including HTML views, PDF and ePub downloads, according to the available data) and Abstracts Views on Vision4Press platform.
Data correspond to usage on the plateform after 2015. The current usage metrics is available 48-96 hours after online publication and is updated daily on week days.
Initial download of the metrics may take a while.