Fig. 10
Download original image
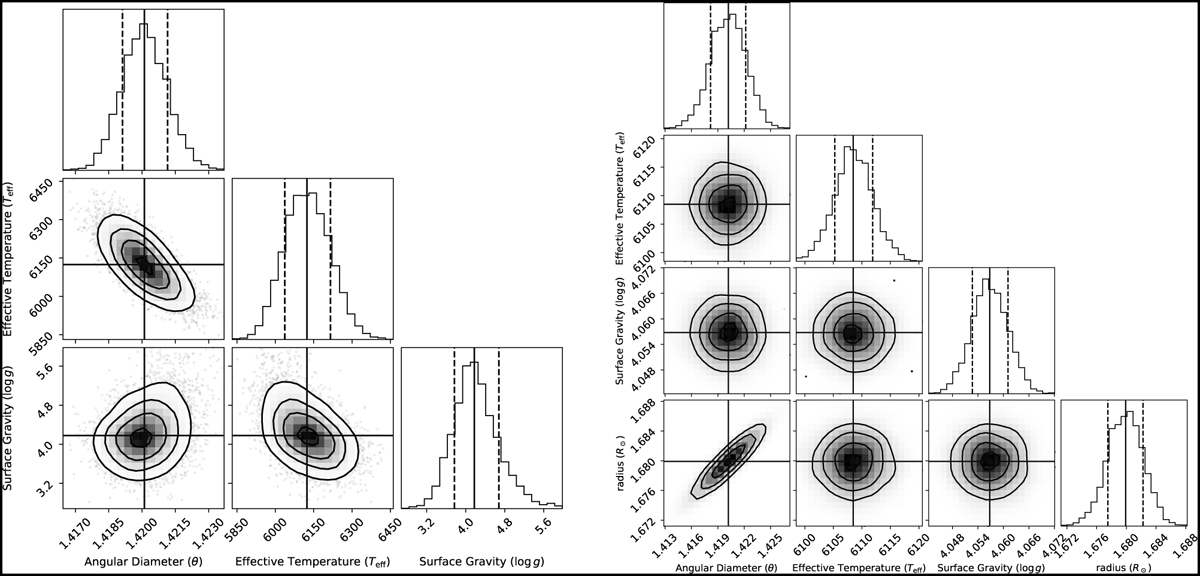
Parameter range for β Vir (corner plot). The solid line in the plot is the median value after running MCMC, the dotted line represents 1σ and the contours on the plot represent 1, 2, and 3σ. The corner plot for interferometry alone (left) and the combined corner plots (right) with interferometry, spectroscopy, and photometry (SPI method).
Current usage metrics show cumulative count of Article Views (full-text article views including HTML views, PDF and ePub downloads, according to the available data) and Abstracts Views on Vision4Press platform.
Data correspond to usage on the plateform after 2015. The current usage metrics is available 48-96 hours after online publication and is updated daily on week days.
Initial download of the metrics may take a while.