Fig. 5.
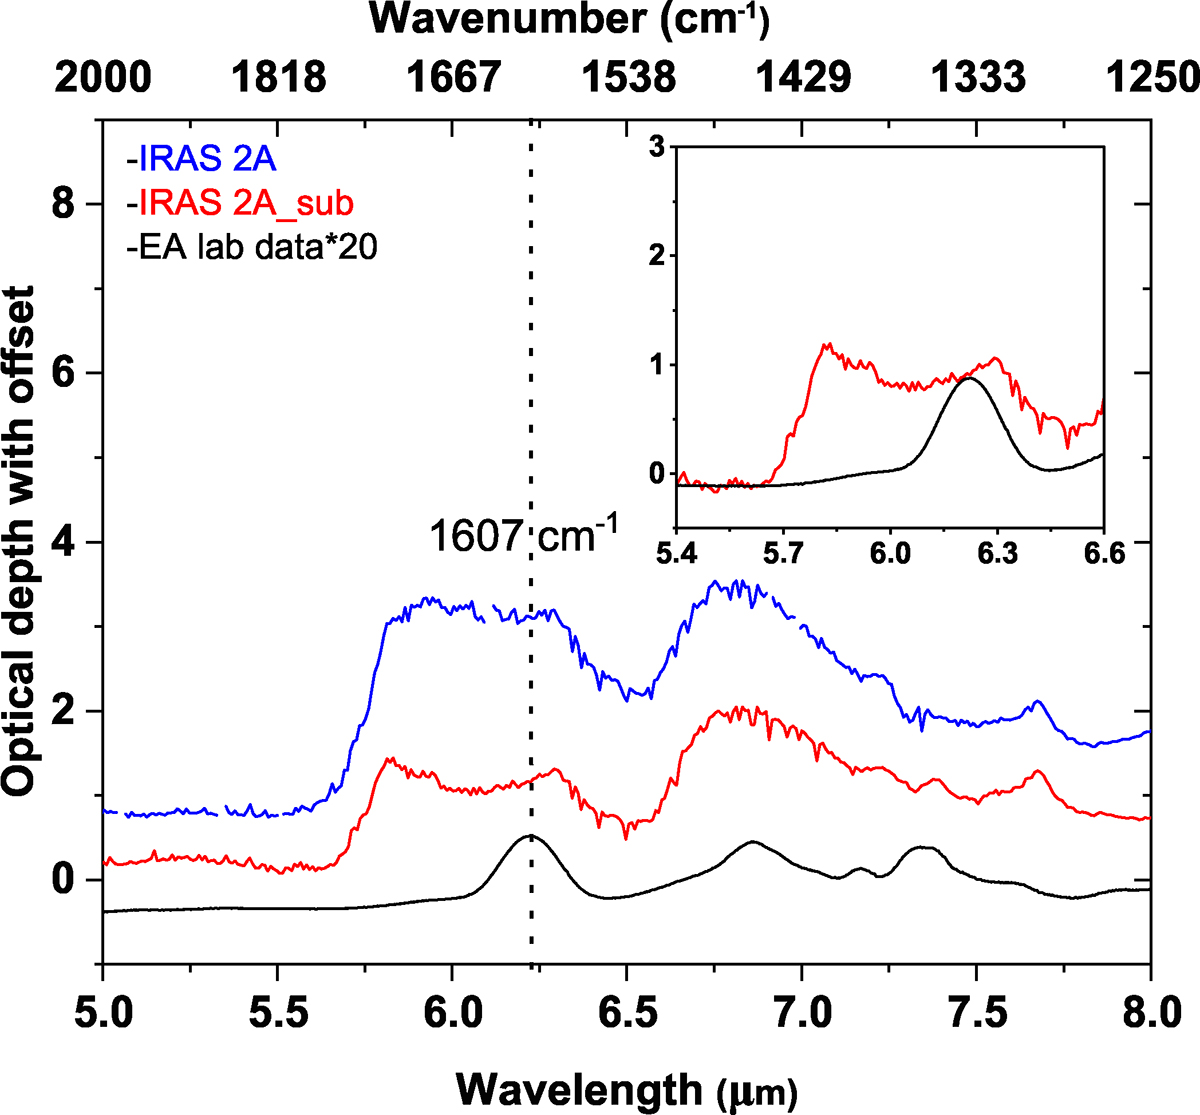
Download original image
Comparison of the JWST/MIRI MRS spectra of IRAS 2A (blue curve) and IRAS 2A with water:silicate features subtracted (red curve) to the laboratory-measured EA ice profile at 10 K. For clearer comparison, all spectra are vertically shifted, and the laboratory spectrum intensity is multiplied by 20, and the EA band at 1607 cm−1 is indicated by dashed line. The inset provides a closer examination of the water:silicate subtracted IRAS 2A spectrum alongside the fitted EA profile for upper limit estimation.
Current usage metrics show cumulative count of Article Views (full-text article views including HTML views, PDF and ePub downloads, according to the available data) and Abstracts Views on Vision4Press platform.
Data correspond to usage on the plateform after 2015. The current usage metrics is available 48-96 hours after online publication and is updated daily on week days.
Initial download of the metrics may take a while.