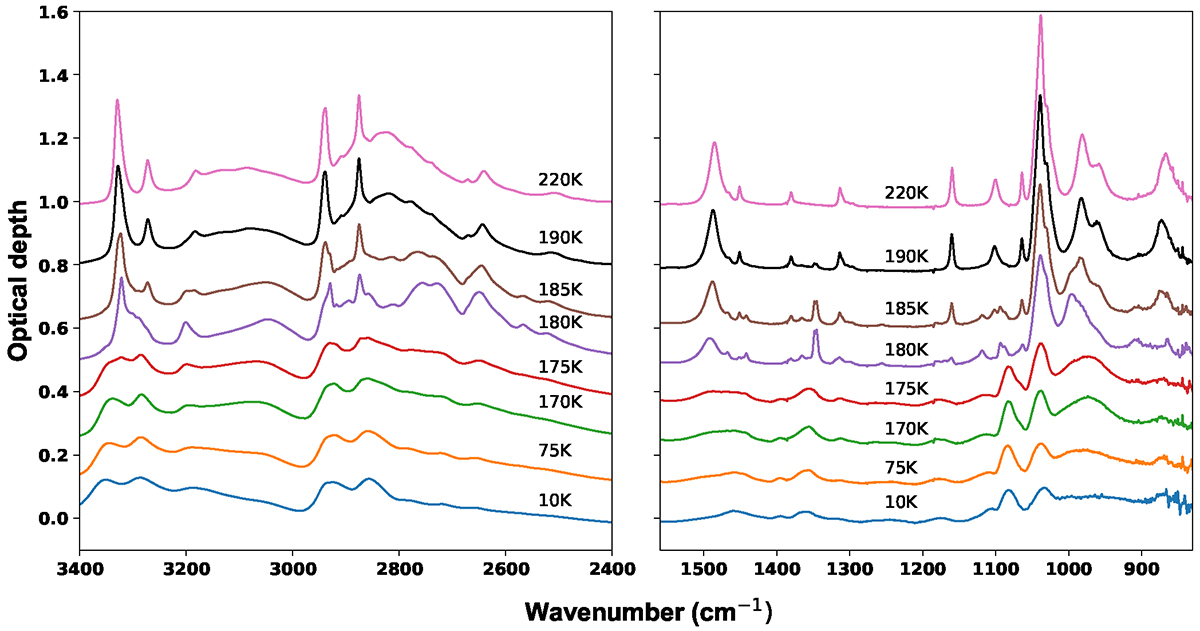
Fig. 2.
Download original image
Series of mid-IR spectra of EA shown at different temperatures and two different spectral regions. About 200 ML of EA were initially condensed on the KBr surface at 10 K and warmed up to 250 K with a linear heating ramp. Spectra are shifted in ordinate for clarity. The spectrum at 190 K is made bold to indicate the complete phase transition from amorphous to crystalline.
Current usage metrics show cumulative count of Article Views (full-text article views including HTML views, PDF and ePub downloads, according to the available data) and Abstracts Views on Vision4Press platform.
Data correspond to usage on the plateform after 2015. The current usage metrics is available 48-96 hours after online publication and is updated daily on week days.
Initial download of the metrics may take a while.