Open Access
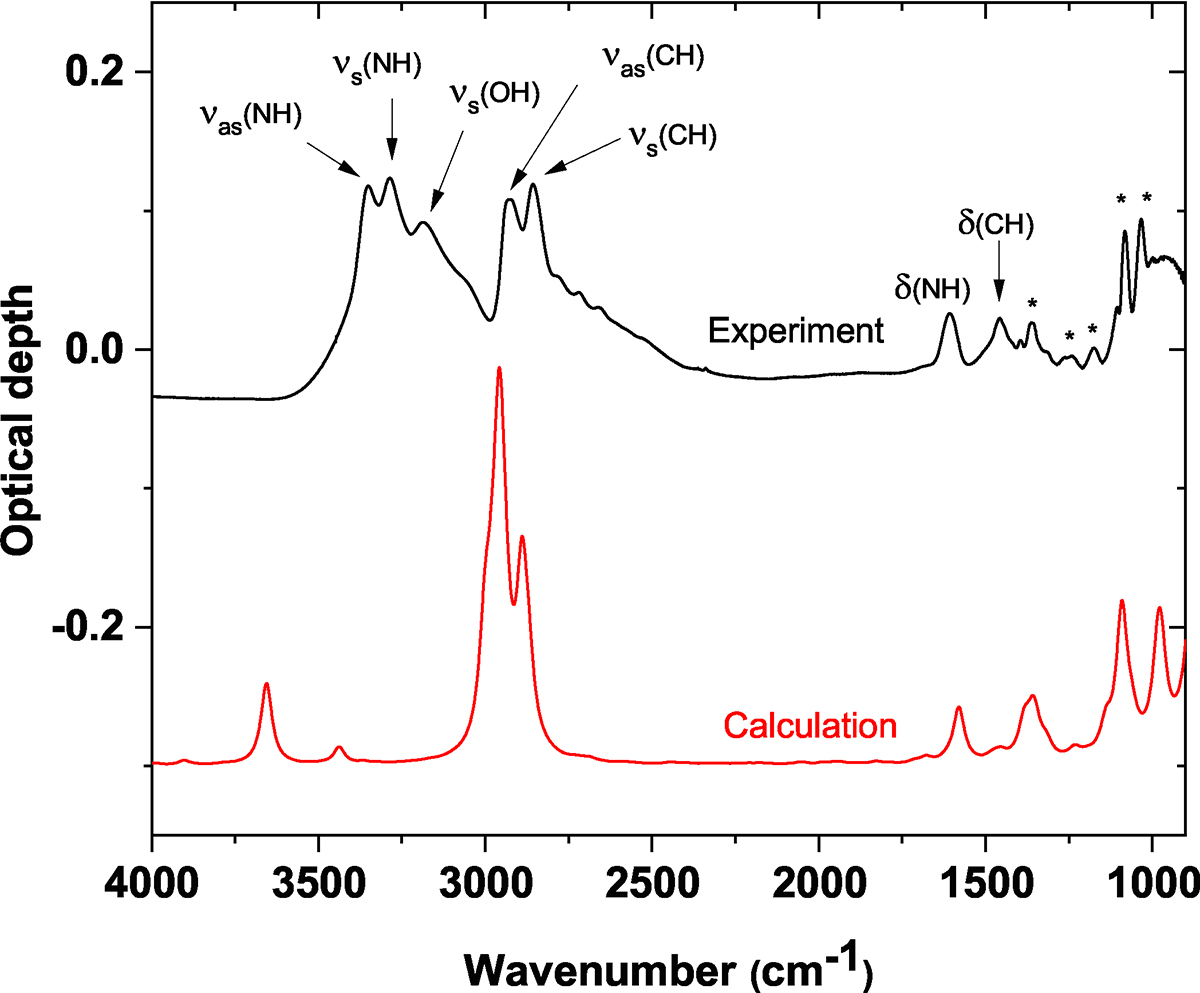
Fig. 1.
Download original image
Experimental and theoretical mid-IR spectrum of EA. The upper one shows about 200 monolayers (ML) of EA condensed on KBr at 10 K. The IR bands marked with asterisks are due to a mixture of different vibrational modes. For the latter, calculations were performed at MP2/Aug-cc-pVTZ level.
Current usage metrics show cumulative count of Article Views (full-text article views including HTML views, PDF and ePub downloads, according to the available data) and Abstracts Views on Vision4Press platform.
Data correspond to usage on the plateform after 2015. The current usage metrics is available 48-96 hours after online publication and is updated daily on week days.
Initial download of the metrics may take a while.