Fig. 6.
Download original image
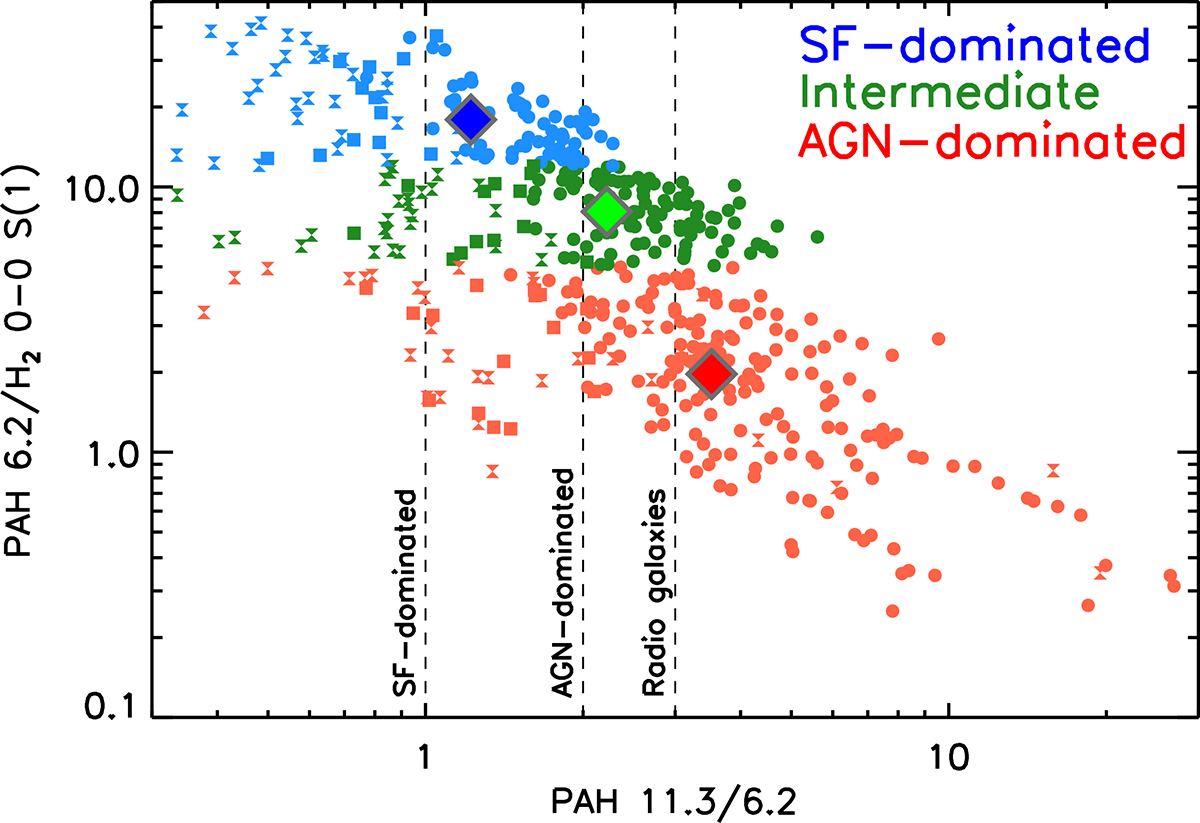
Relationship between the 11.3/6.2 PAH ratio and 6.2 μm PAH feature relative to H2 S(1) for all the spaxels of the three targets. Blue, green, and red circles represent values where the 6.2 μm PAH/H2 S(1) ratio is greater than 12 (SF-dominated), between 12 and 5, and less than 5 (AGN-dominated), respectively. Squares represent the median value of each category. Squares, circles and hourglasses symbols correspond to NGC 5506, NGC 5728, and NGC 7172. The dashed vertical lines represent the average values of star-forming galaxies, AGNs, and relatively powerful radio galaxies from Spitzer/IRS observations (Ogle et al. 2010 and García-Bernete et al. 2022c).
Current usage metrics show cumulative count of Article Views (full-text article views including HTML views, PDF and ePub downloads, according to the available data) and Abstracts Views on Vision4Press platform.
Data correspond to usage on the plateform after 2015. The current usage metrics is available 48-96 hours after online publication and is updated daily on week days.
Initial download of the metrics may take a while.