Fig. 5.
Download original image
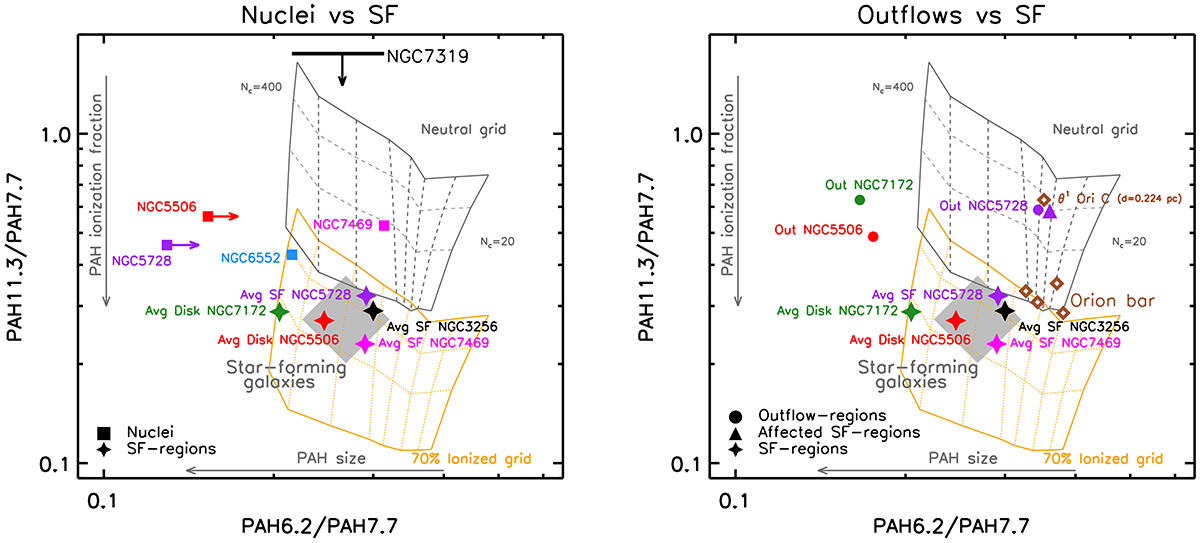
PAH diagnostic diagram: relative strengths of the 6.2, 7.7, and 11.3 μm PAH features. Left panel: Nuclear regions of AGNs versus star-forming regions. Filled squares correspond to the nuclear regions of NGC 5728 (purple square) and NGC 5506 (red square). We also plot the nuclear regions of NGC 6552 (blue square), NGC 7319 (black upper limit) and NGC 7469 (magenta square) from García-Bernete et al. (2022d). Right panel: Outflow regions of AGNs versus star-forming regions. The red, purple, and green circles correspond to average PAH ratios of the outflow regions of NGC 5506, NGC 5728 and NGC 7172, respectively. The purple triangle represents the average value of star-forming regions of NGC 5728 that are affected by the AGN according to their [Ne III]/[Ne II] ratio. For comparison, we plot PDR-like values from the Orion bar (open brown diamond; see Appendix B for details). The grey shaded region denotes the average location of star-forming galaxies from García-Bernete et al. (2022c) using Spitzer/IRS data and black and magenta filled stars correspond to the average value of star-forming regions of NGC 3256 (from Rigopoulou et al. 2024) and NGC 7469 (from García-Bernete et al. 2022d). Filled stars correspond to the average star-forming regions of NGC 5728 (purple star), NGC 7172 (green star) and NGC 5506 (red star). The grey grid corresponds to neutral PAHs ranging from small PAHs (N![]() ; right side of the grid) to large PAH molecules (N
; right side of the grid) to large PAH molecules (N![]() ; left side of the grid). Dashed grey lines correspond to intermediate numbers of carbons. The orange grid corresponds to 70% of ionised PAH molecules for the same number of carbons as the neutral grid. Dotted orange lines correspond to intermediate numbers of carbons. In Fig. A.4, we show this plot with all the individual regions, and in Tables A.1, A.2, and A.3 we list the measured PAH fluxes.
; left side of the grid). Dashed grey lines correspond to intermediate numbers of carbons. The orange grid corresponds to 70% of ionised PAH molecules for the same number of carbons as the neutral grid. Dotted orange lines correspond to intermediate numbers of carbons. In Fig. A.4, we show this plot with all the individual regions, and in Tables A.1, A.2, and A.3 we list the measured PAH fluxes.
Current usage metrics show cumulative count of Article Views (full-text article views including HTML views, PDF and ePub downloads, according to the available data) and Abstracts Views on Vision4Press platform.
Data correspond to usage on the plateform after 2015. The current usage metrics is available 48-96 hours after online publication and is updated daily on week days.
Initial download of the metrics may take a while.