Fig. 3.
Download original image
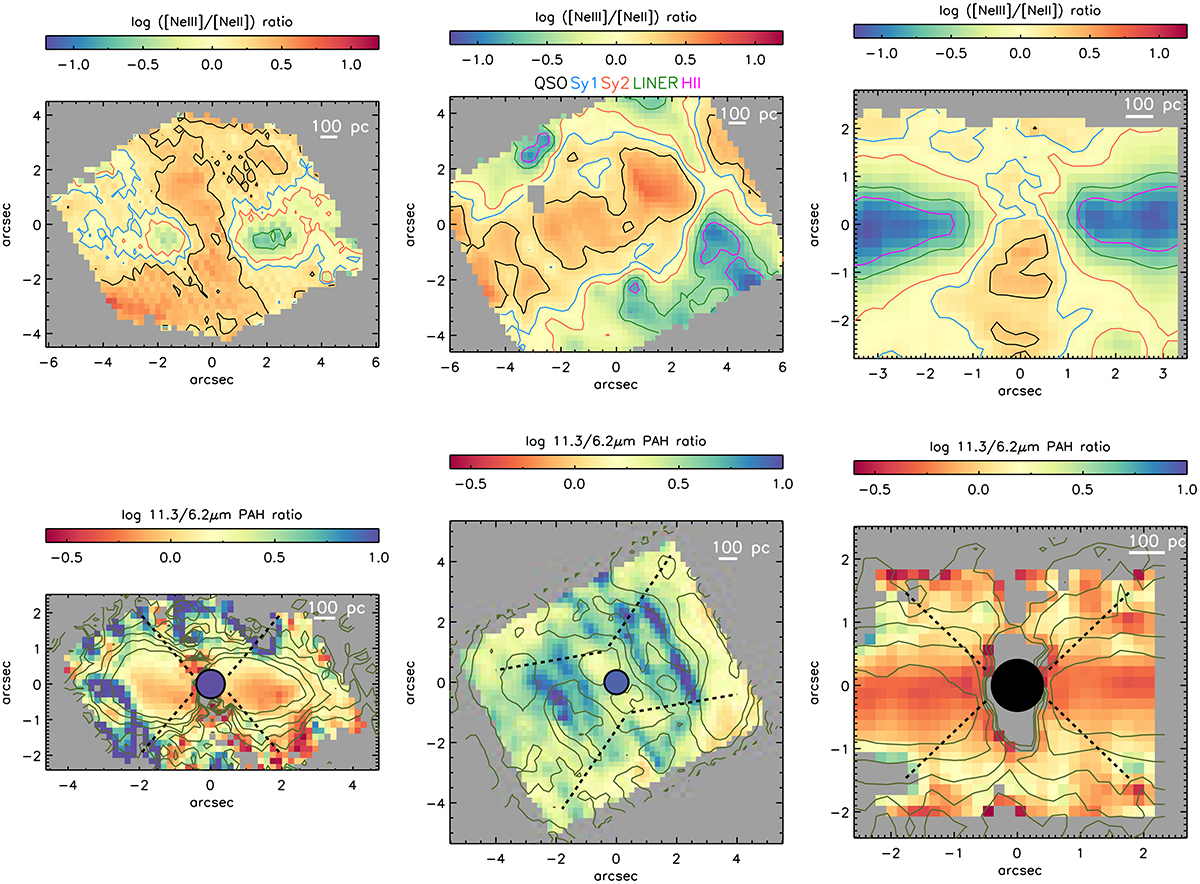
JWST/MRS spatially resolved maps. From left to right panels: NGC 5506, NCG 5728, and NGC 7172. Top panels: Hardness of the radiation field maps traced by the [Ne III]/[Ne II] ratios. The colour-coded contours correspond to the average [Ne III]/[Ne II] ratios found in QSO (black line), Sy1 (blue line), Sy2 (red line), LINER (green line), and H II (magenta line) regions reported in Pereira-Santaella et al. (2010). Bottom panels: 11.3/6.2 PAH ratio maps. Dark green contours correspond to the 11.3 μm PAH emission. The first contour is at 3σ and the last contour at 1.5 × 10⁻¹⁵ erg s−1 cm−2. Colour-coded circles correspond to the nuclear PAH ratios. The central regions correspond to the 11.3/6.2 PAH ratios measured in the nuclear spectra. For NGC 7172, the black circle represent the non-detection of nuclear PAH for this source (see Sect. 5.1 for further details). North is up and east is to the left, and offsets are measured relative to the AGN.
Current usage metrics show cumulative count of Article Views (full-text article views including HTML views, PDF and ePub downloads, according to the available data) and Abstracts Views on Vision4Press platform.
Data correspond to usage on the plateform after 2015. The current usage metrics is available 48-96 hours after online publication and is updated daily on week days.
Initial download of the metrics may take a while.