Fig. C.5.
Download original image
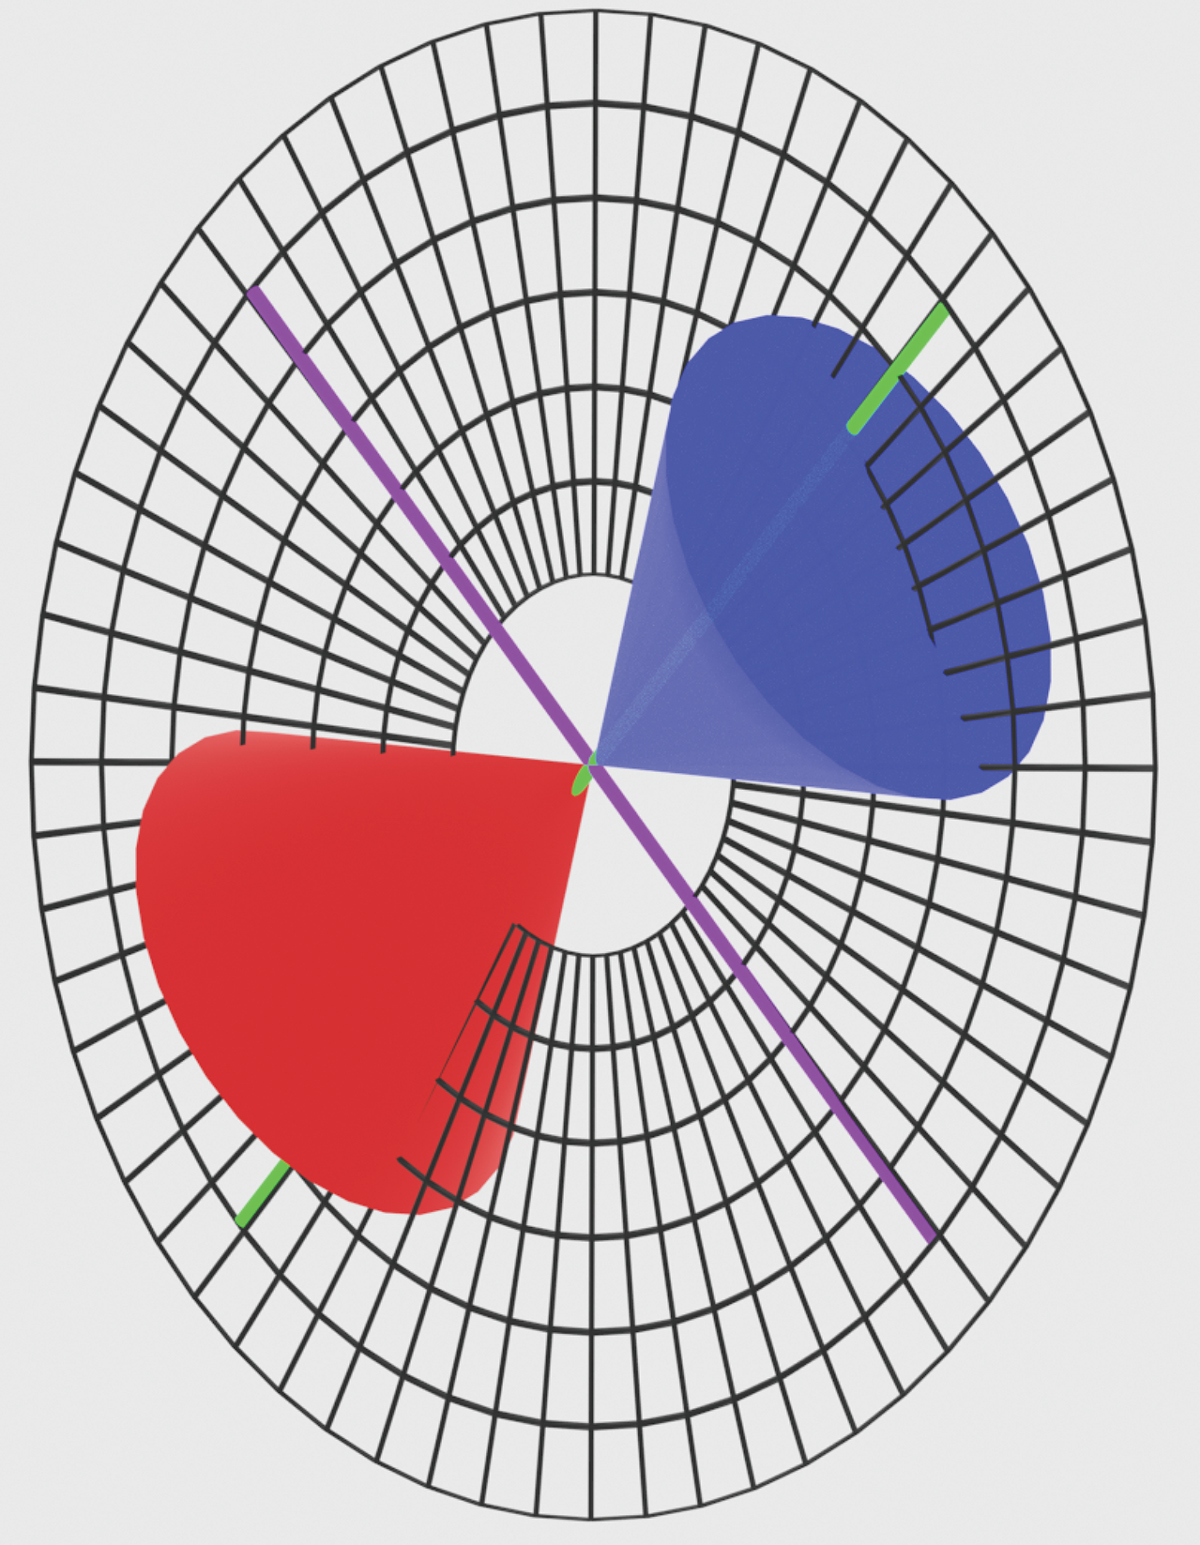
3D scheme for the geometry of NGC 5728 derived from the NLR modeling by Shimizu et al. (2019). Note that the position angle of the cone has been updated to that used in Davies et al. (2024). The bicone indicates the AGN outflow (blue and redshifted velocities). The green line represents the jet axis. The purple line correspond to the perpendicular direction of the jet-axis (i.e. high velocity dispersion region in Fig. 4). North is up and east is left.
Current usage metrics show cumulative count of Article Views (full-text article views including HTML views, PDF and ePub downloads, according to the available data) and Abstracts Views on Vision4Press platform.
Data correspond to usage on the plateform after 2015. The current usage metrics is available 48-96 hours after online publication and is updated daily on week days.
Initial download of the metrics may take a while.