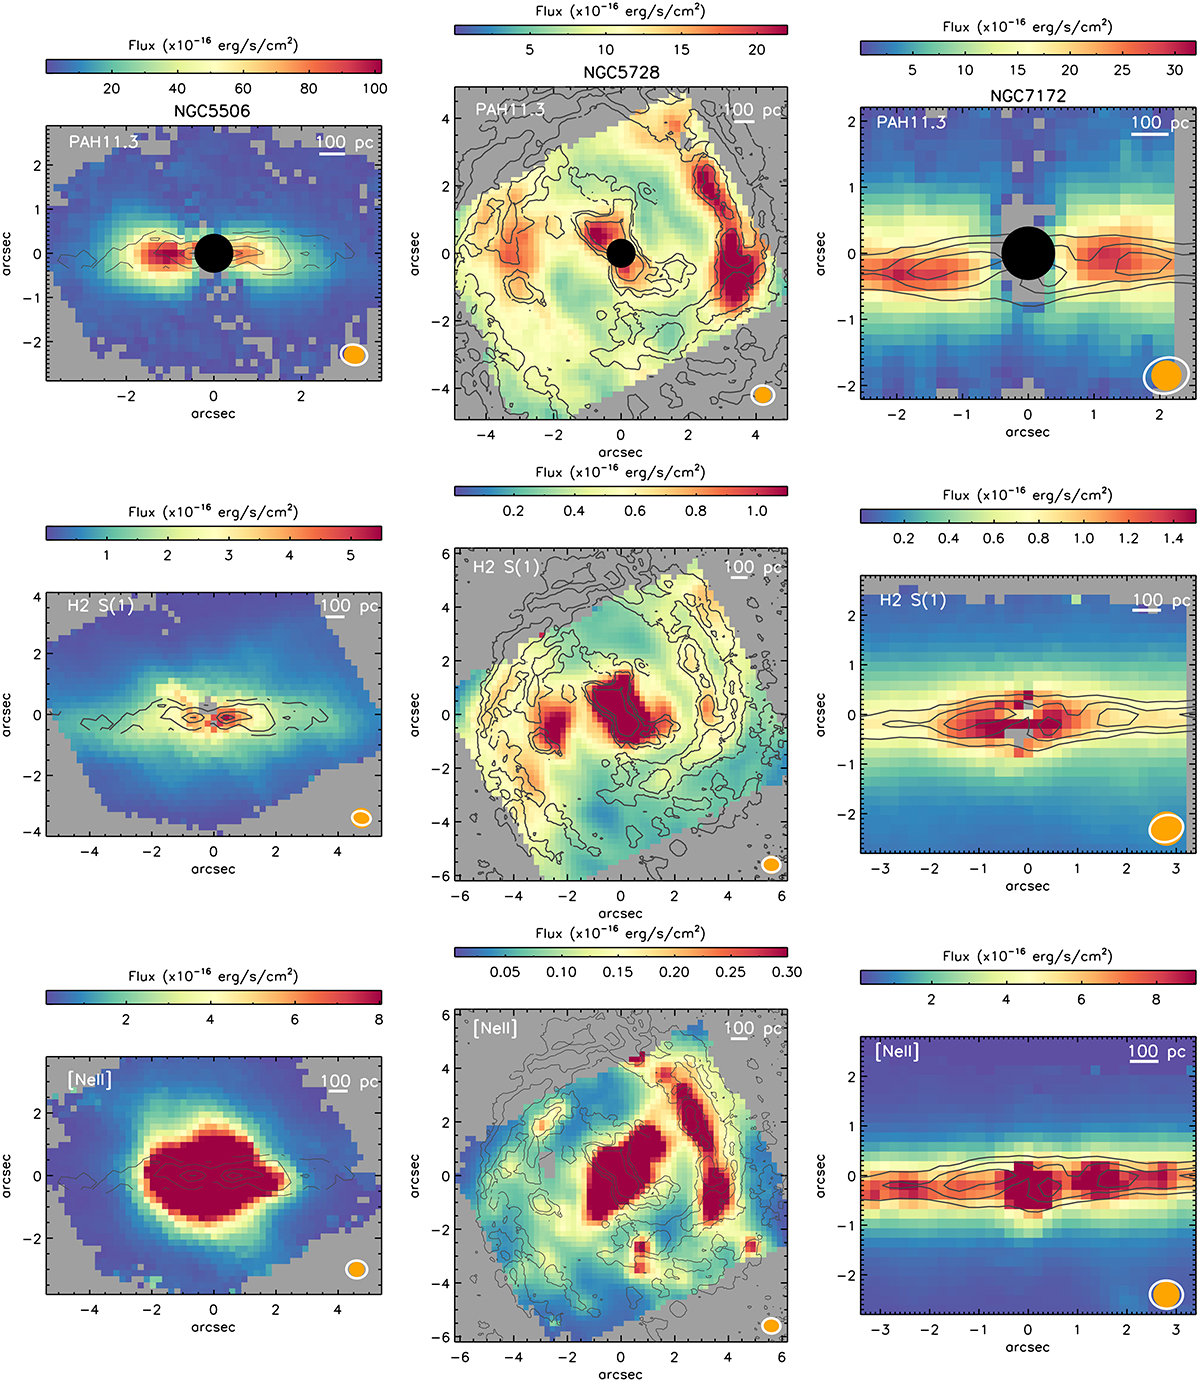
Fig. 1.
Download original image
JWST/MRS emission line maps. From left to right: NGC 5506, NCG 5728 and NGC 7172. Top panels: 11.3 μm PAH feature intensity map. Central panels: H2 S(1) at 17.03 μm intensity map. Bottom panels: [Ne II] 12.81 μm intensity map. The black contours are the CO(3-2) emission from ALMA on a logarithmic scale. The first and last contours lie at 3σ and the peak flux, respectively. North is up and east is to the left, and offsets are measured relative to the AGN. Orange solid circle and white ellipse correspond to the JWST and ALMA beams, respectively.
Current usage metrics show cumulative count of Article Views (full-text article views including HTML views, PDF and ePub downloads, according to the available data) and Abstracts Views on Vision4Press platform.
Data correspond to usage on the plateform after 2015. The current usage metrics is available 48-96 hours after online publication and is updated daily on week days.
Initial download of the metrics may take a while.