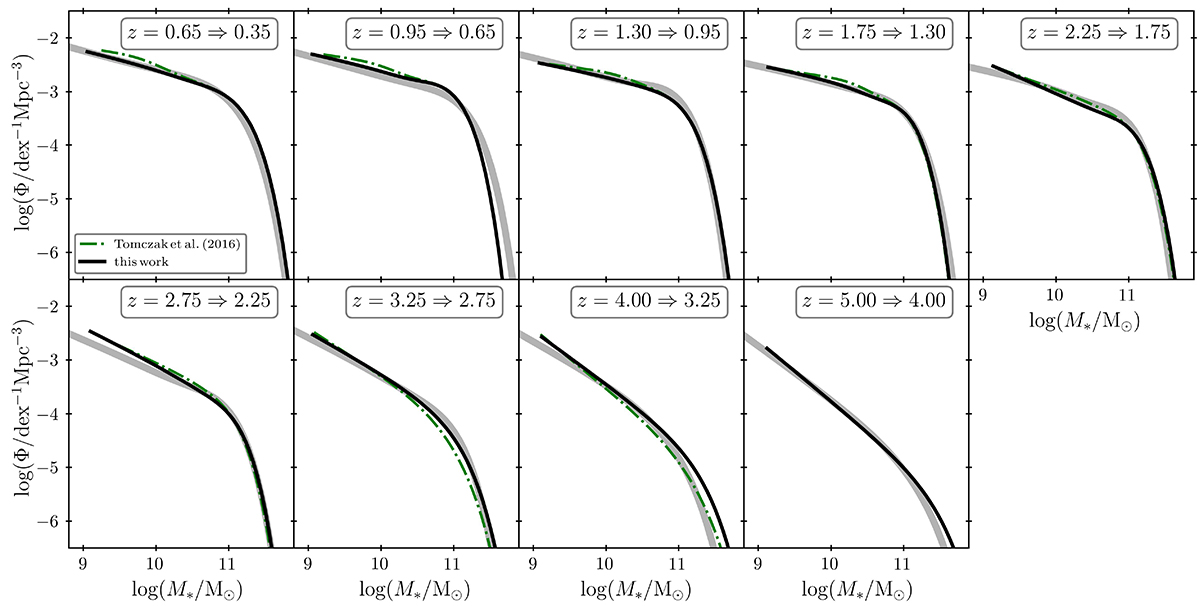
Fig. 9.
Download original image
Comparison between the observed and simulated GSMFs, where both star-forming and quiescent galaxies are considered. To extend the redshift range, the simulated GSMFs are constructed by “growing” the observed function of Davidzon et al. (2017), between the redshifts listed in the upper right corner of each panel, according to Eq. (11). The mass evolution results from assuming the SFR-M* relation characteristic of galaxy samples including both the star-forming and quiescent sources, where we compare our results, shown in solid black, with those of Tomczak et al. (2016), depicted with a dash-dotted green line. The thick solid gray line represents the observed GSMF at the final redshift of each simulation. It can be seen that the significant gap in densities, apparent in Fig. 8, is no longer present, indicating that, indeed, the inconsistencies were caused by the fraction of sources evolving into quiescent mode, as is discussed in Sect. 5.4. The low-mass slope of simulated GSMFs at z ≳ 2 is inconsistent with the observed function, indicating that the corresponding slope of the SFR-M* relations most likely evolves toward steeper values toward earlier epochs.
Current usage metrics show cumulative count of Article Views (full-text article views including HTML views, PDF and ePub downloads, according to the available data) and Abstracts Views on Vision4Press platform.
Data correspond to usage on the plateform after 2015. The current usage metrics is available 48-96 hours after online publication and is updated daily on week days.
Initial download of the metrics may take a while.